

")
The market started off the first week of New Year 2023 on a disappointing note with the Nifty50 down 1.4 percent and decisively broke the psychological 18,000 mark in the week ended January 6 after Fed officials signalled an aggressive stance to control inflation.
The index closed at 17,859 after trading within the range of previous two weeks and formed a bearish candle on the weekly time frame, but has taken support at 17,750, which is expected to be a crucial support point for the current week beginning January 9, with the initial hurdle at 18,000, followed by 18,200 levels, experts said.
"As of now, we are still a bit hopeful of recovery; but in case the Nifty slides and sustains below 17,750, we must prepare for an extension of this corrective move towards 17,600 – 17,450 in the coming week," Sameet Chavan, Chief Analyst-Technical and Derivatives at Angel One, said.
On the flipside, he feels that in order to regain the strength, the Nifty must reclaim 18,000 first on a closing basis. The major trend-deciding level remains at 18,300, which would turn the tide once again in favour of bulls, he said.
The market expert advised traders to keep a close tab on all these scenarios. The only positive takeaway at the end of the week would be the resilience of the broader market, he feels.
Let's take a look at the top 10 trading ideas by experts for the next three-four weeks. Returns are based on the January 6 closing prices:
Expert: Nandish Shah, Senior Derivative and Technical Analyst at HDFC Securities
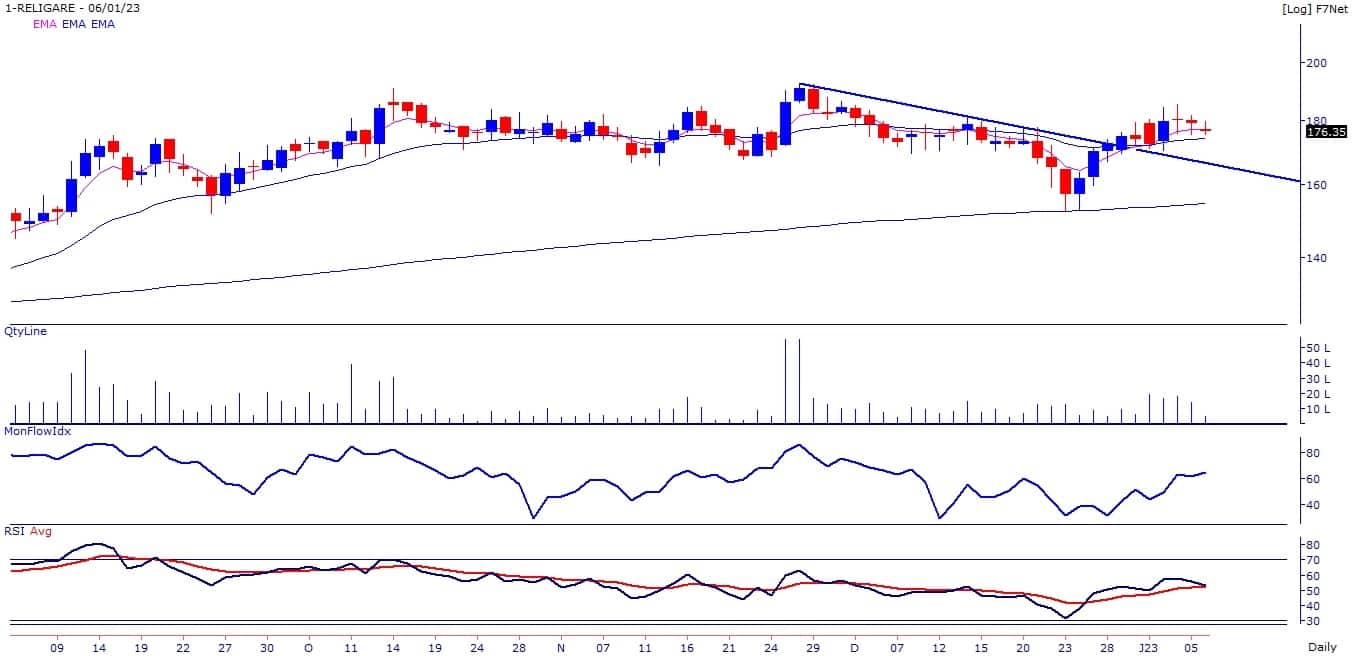
Religare Enterprises: Buy | LTP: Rs 176.35 | Stop-Loss: Rs 164 | Target: Rs 190-199 | Return: 13 percent
After breaking out from the downward sloping trendline on the daily chart, stock price is consolidating during last few days, indicating relative strength in the stock. Short and medium term trend remains positive as stock price is trading above all important moving averages.
Momentum Oscillators - RSI (relative strength index - 11) and MFI (money flow index - 10) are sloping upwards and placed above 50 on the weekly chart, indicating strength in the stock. One can buy the stock in the range of Rs 176.35-170.
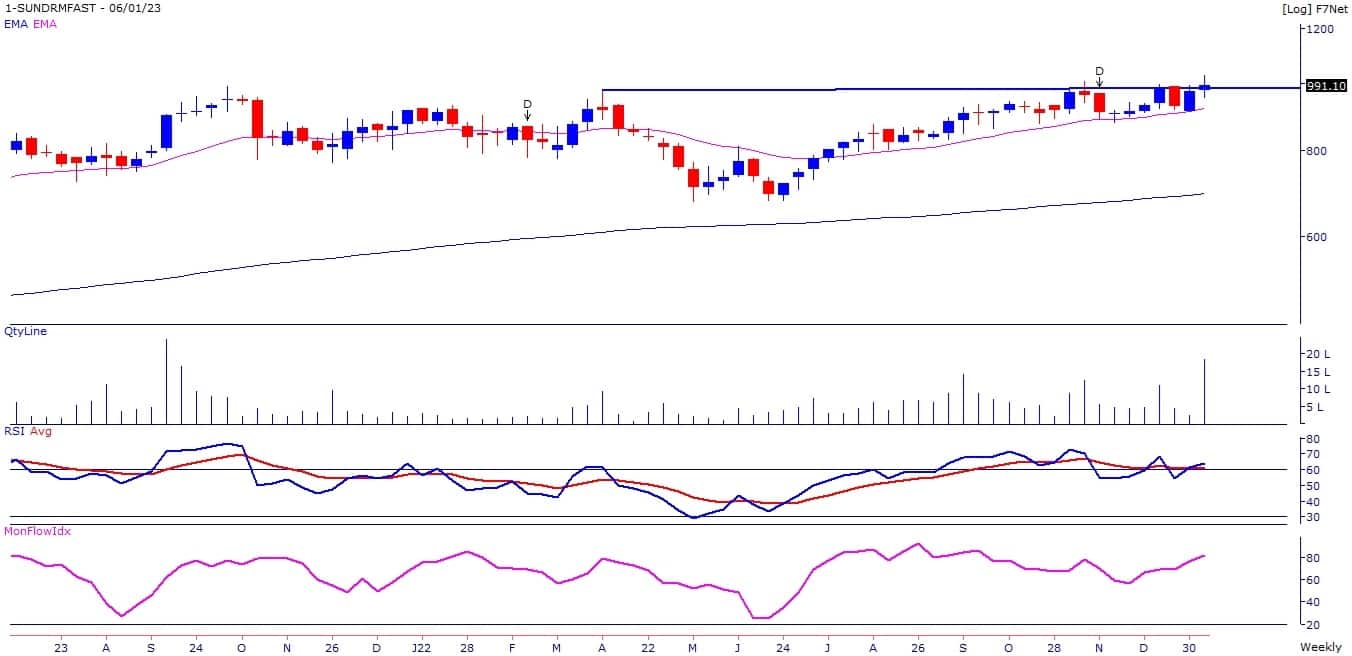
Sundram Fasteners: Buy | LTP: Rs 991 | Stop-Loss: Rs 920 | Target: Rs 1,070-1,100 | Return: 11 percent
The stock price has broken out on the weekly chart from the multiple top resistance of Rs 980-985 levels. Short term trend of the stock is positive as stock price is trading above its 5 and 20-day EMA (exponential moving average).
Momentum Oscillators - RSI (11) and MFI (10) is placed above 50 on the weekly chart, indicating relative strength in the stock. One can buy the stock in the range of Rs 991-950.
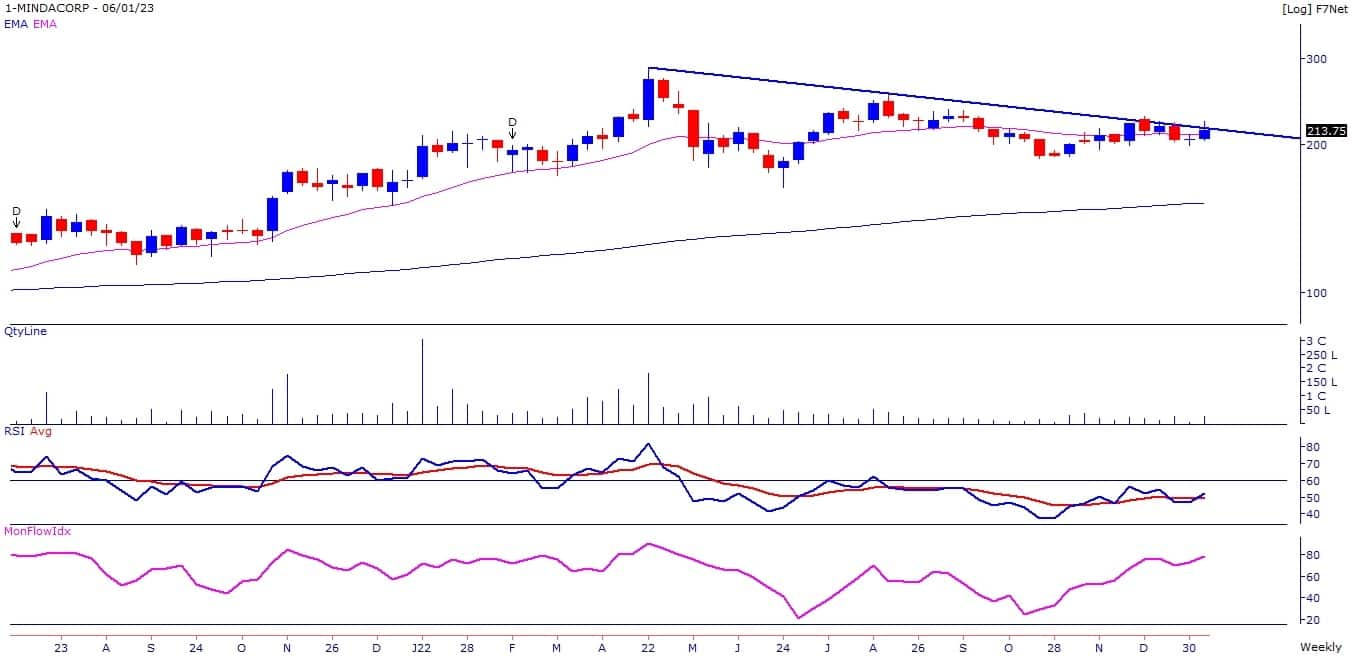
Minda Corporation: Buy | LTP: Rs 213.75 | Stop-Loss: Rs 200 | Target: Rs 229-235 | Return: 10 percent
The stock price is on the verge of breaking out from the downward sloping trendline on the weekly chart. Stock price has been taking support at 200-day EMA. Intermediate trend of stock remains positive as it is trading above its 50, 100 and 200-day moving averages.
Auto ancillaries' stocks are looking good on the medium-term charts. One can buy the stock in the range of Rs 213.75-208.
Expert: Shrikant Chouhan, Head of Equity Research ( Retail) at Kotak Securities
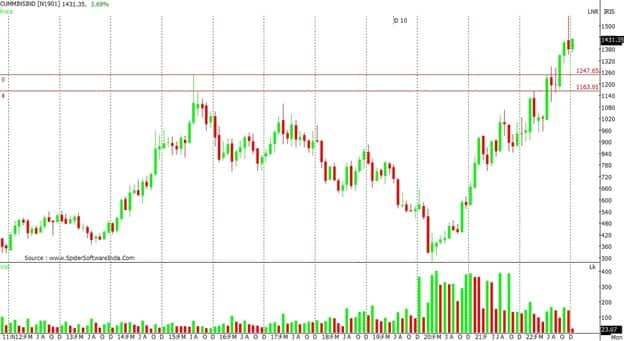
Cummins India: Buy | LTP: Rs 1,431.35 | Stop-Loss: Rs 1,390 | Target: Rs 1,500-1,550 | Return: 8 percent
The stock has formed a higher bottom at Rs 1,351 and closed in positive territory on a weekly basis. The stock is following a bullish formation, which crossed Rs 1,270 level in October 2022.
Based on the short-term formation of the stock, technically, it is moving towards Rs 1,500-1,550 levels. Buy at the current level and place a stop-loss at Rs 1,390.
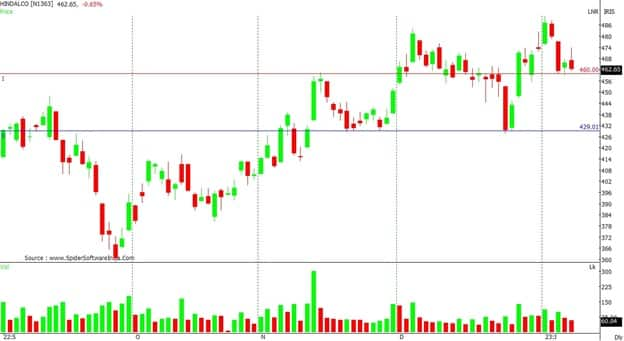
Hindalco Industries: Buy | LTP: Rs 462.65 | Stop-Loss: Rs 450 | Target: Rs 491 | Return: 6 percent
After making several bottoms between 425 and 430, the stock quickly reversed to Rs 491 levels. A sector-specific move supported the rally in the stock on strong gains in Asian markets.
Last week, the stock fell to Rs 460 level due to continued weakness in the US market. At current levels, the stock is attractive to buy from a trading point of view. However, a stop-loss at Rs 450 is required.
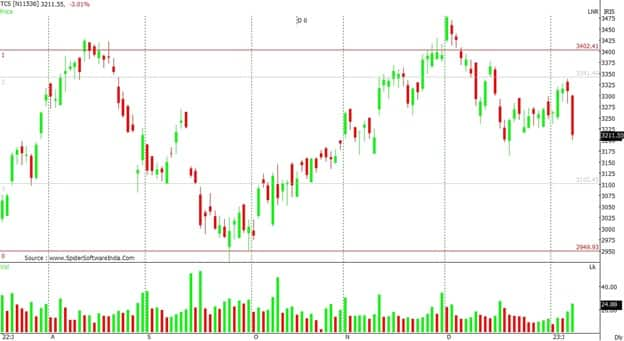
Tata Consultancy Services: Sell | LTP: Rs 3,211.55 | Stop-Loss: Rs 3,300 | Target: Rs 3,175-3,100 | Return: 3.5 percent
The stock has formed a series of falling tops and falling bottoms, which is a bearish formation. The levels of Rs 3,300 and Rs 3,400 are acting as major resistance zone for the stock.
On Friday, the stock closed below the level of Rs 3250, which would pull the stock to Rs 3,175 or Rs 3,100 in the near term. It is advisable to sell at Rs 3,215 and at Rs 3,250. However, keep a stop loss at Rs 3,300 to protect a short sell position.
Expert: Jatin Gohil, Technical and Derivative Research Analyst at Reliance Securities
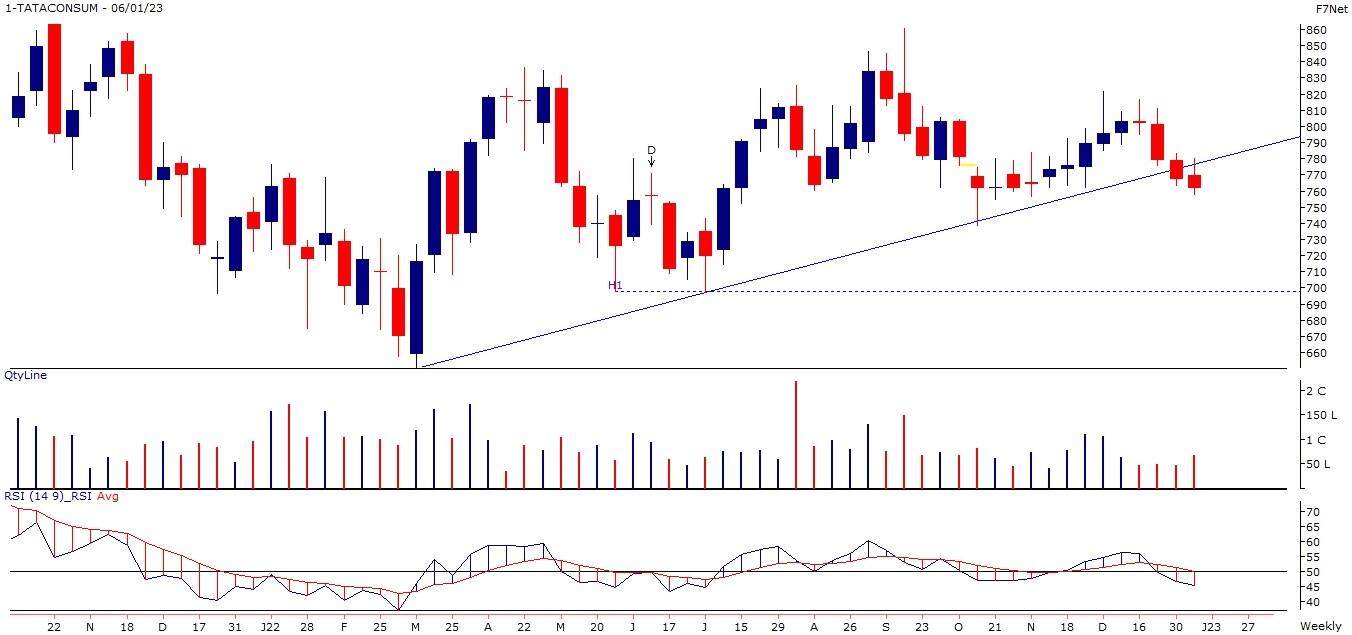
Tata Consumer Products: Sell | LTP: Rs 761.35 | Stop-Loss: Rs 795 | Target: Rs 702 | Return: 8 percent
In late-December 2022, the stock witnessed a trendline breakdown and extended loss subsequently. Continuing its prior weekly falling trend, the stock slipped to 11-week low during the last week.
Its weekly RSI slipped below 50-mark post negative cross-over. This could drag the stock towards its psychological level of Rs 700, where its lowest level of May 2022 and June 2022 are also placed.
In case of any pullback, the stock may face hurdle around its extending trendline.
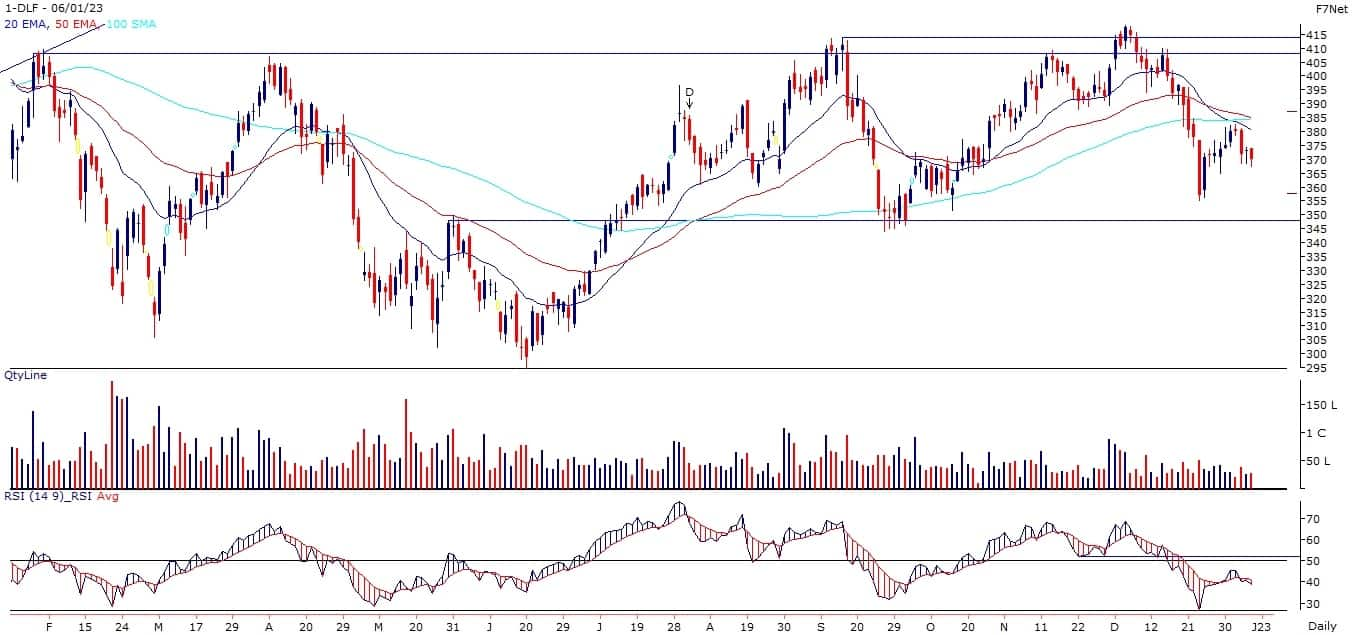
DLF: Sell | LTP: Rs 370 | Stop-Loss: Rs 387 | Target: Rs 346 | Return: 6.5 percent
The stock resumed its down move post a pullback. On the higher side, the stock faced hurdle around the junction of key moving averages on the daily timeframe chart.
Its daily RSI reversed before testing 50-mark. We believe undergoing negative momentum may continue, which could drag the stock towards its lowest level of September 2022.
On the higher side, its key moving averages will cap the up-move.
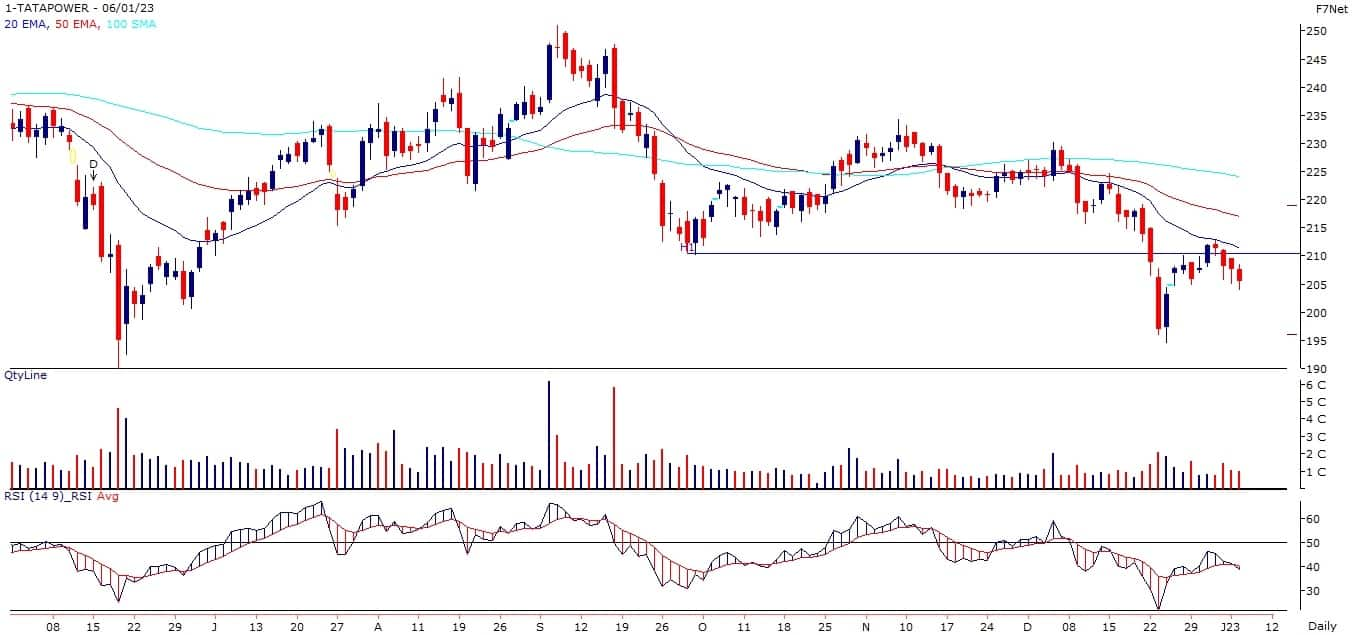
Tata Power: Sell | LTP: Rs 205.4 | Stop-Loss: Rs 213 | Target: Rs 190 | Return: 7.5 percent
The stock reversed after testing its prior point of polarity and moved down. Its major moving averages are sloping downwards and the key technical indicators are negatively poised.
This could drag the stock towards its lowest level of June 2021.
In case of any rebound, the stock will continue to face hurdle around its prior point of polarity.
Expert: Ruchit Jain, Lead Research at 5paisa
Petronet LNG: Buy | LTP: Rs 218 | Stop-Loss: Rs 206 | Target: Rs 235-240 | Return: 10 percent
The stock has seen a long consolidation phase and has traded within a broad range since last three years and has now given a breakout from a falling trendline resistance. Off late, the stock has witnessed positive momentum as the ‘89 DEMA’ has acted as a support during the recent decline.
The volumes during price corrections are low while they are rising gradually along with price upmoves indicating buying interest by market participants. The RSI Smoothed oscillator has given a positive crossover on the daily chart and is in ‘Buy Mode’ on the weekly charts too.
Considering the technical structure, we expect the stock to rally higher in the near term and hence, short term traders can look for buying opportunities around current price of Rs 218. The possible near term targets for the stock are expected around Rs 235-240, while the stop-loss for long positions should be placed below Rs 206.

Bajaj Auto: Buy | LTP: Rs 3,642 | Stop-Loss: Rs 3,540 | Target: Rs 3,740-3,800 | Return: 4 percent
The stock has been consolidating within a range since last few weeks and prices have seen some pullback move from the support end of a ‘Symmetrical Triangle’ pattern. The stock has relatively shown strength as compared to broader markets since last few days and the RSI oscillator has given a positive crossover indicating a positive momentum.
Traders can look to buy the stock in the range of Rs 3,640-3,620 for potential targets around Rs 3,740 and Rs 3,800. The stop-loss for short positions should be placed above Rs 3,540.

Disclaimer: The views and investment tips expressed by investment experts on Moneycontrol.com are their own and not those of the website or its management. Moneycontrol.com advises users to check with certified experts before taking any investment decisions.
Discover the latest business news, Sensex, and Nifty updates. Obtain Personal Finance insights, tax queries, and expert opinions on Moneycontrol or download the Moneycontrol App to stay updated!


