

The market reversed all its previous day's gains with the benchmark indices falling half a percent on December 30, the last day of the year 2022, but the broader markets outperformed frontliners on positive breadth.
The BSE Sensex dropped nearly 300 points to 60,841, while the Nifty50 declined more than 80 points to 18,105 and formed Dark Cloud Cover kind of pattern on the daily charts, indicating some kind of nervousness going ahead as it is bearish reversal pattern.
On the broader markets, the Nifty Midcap 100 index gained half a percent and Smallcap 100 index rose 0.75 percent as about three shares advanced for every two declining shares on the NSE.
The selling in select banking and financial services, FMCG, technology and pharma stocks weighed down the market.
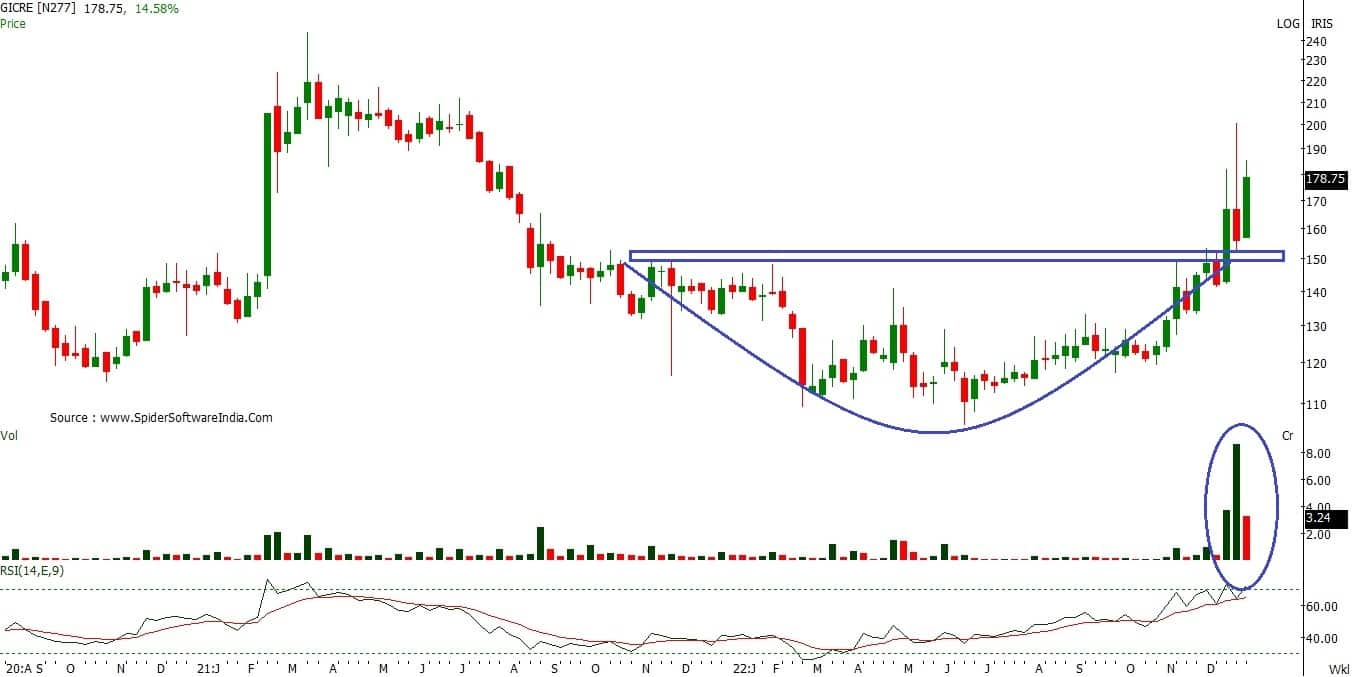
However, stocks that were in action included General Insurance Corporation of India which jumped more than 6 percent to Rs 179 and formed bullish candle on the daily charts with making higher high with above average volumes. In fact, after forming Bullish Harami pattern in the beginning of last week, overall it has been in an uptrend, barring couple of small corrections.
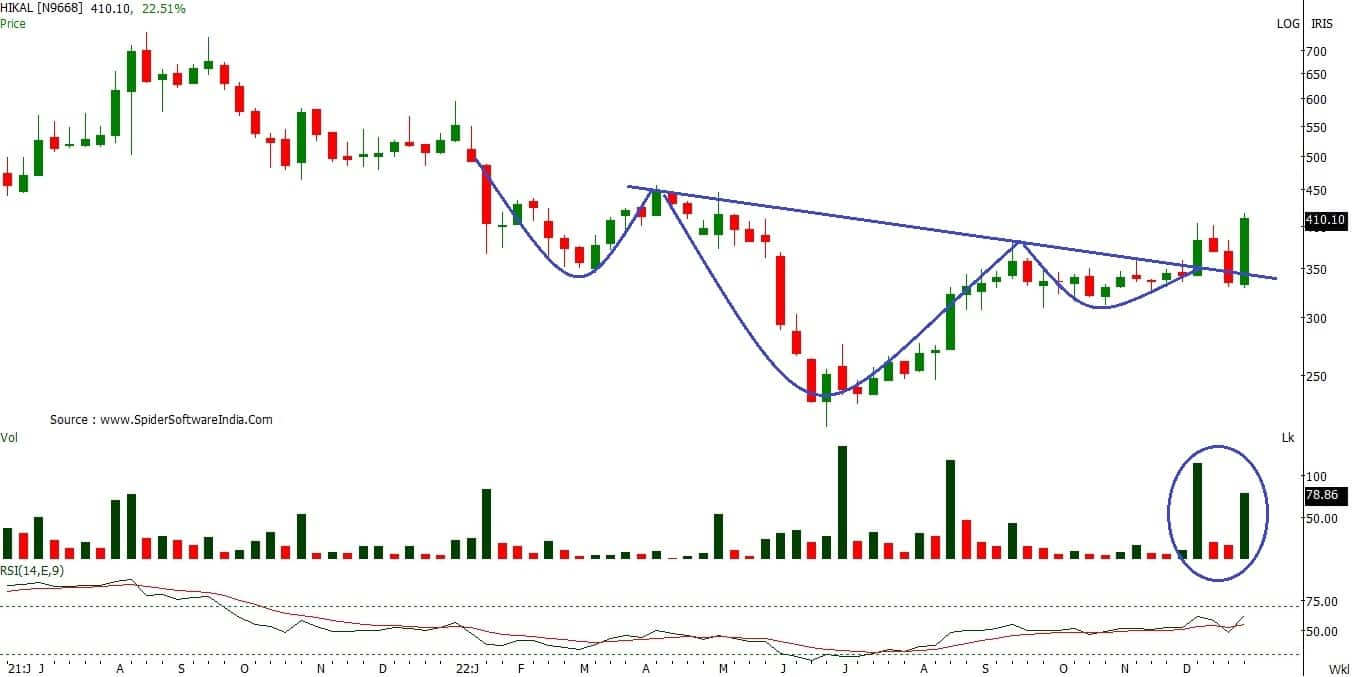
Hikal shares surged 12 percent to Rs 410, the biggest closing level since May 6, 2022 and formed robust bullish candle on the daily charts with higher high formation for fourth straight session with significantly higher volume. The stock has seen a breakout of horizontal resistance trend line adjoining September 15 and December 19, and also breakout of downward sloping resistance trend line adjoining December 13, and December 29, 2022.
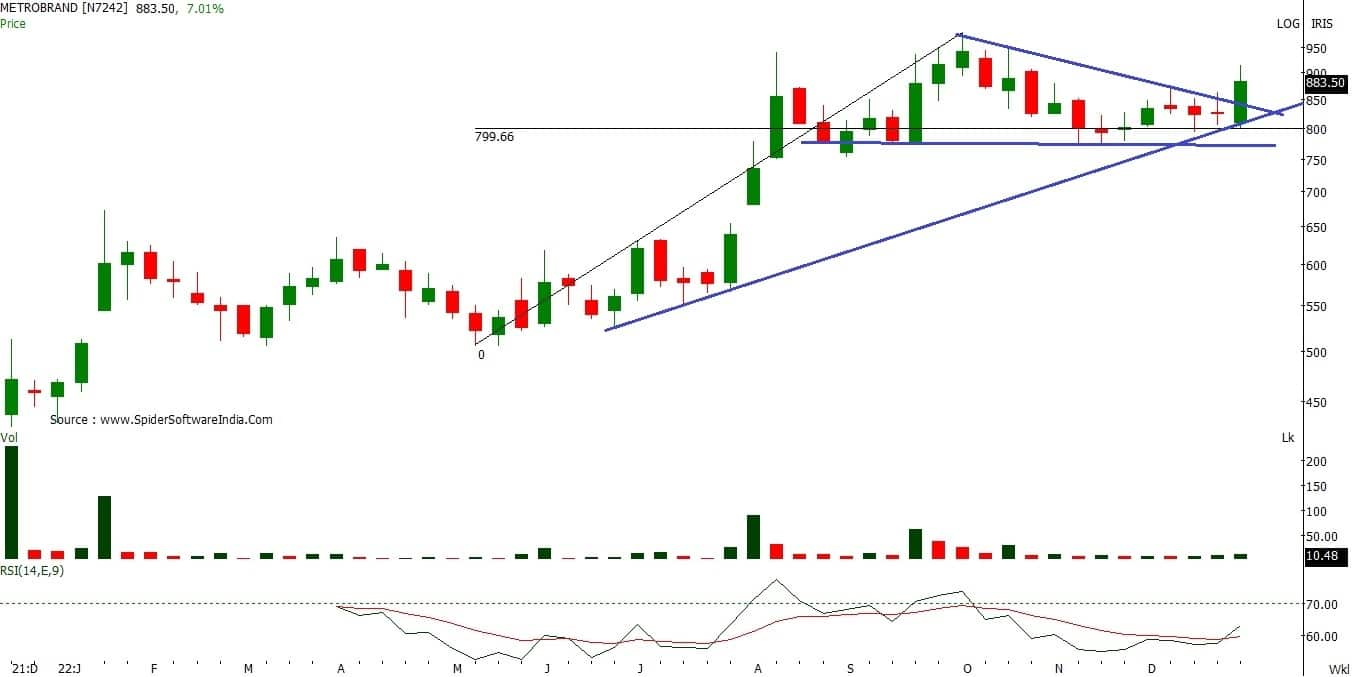
Metro Brands was also in focus, rising 3 percent to Rs 883.50, and formed bullish candle on the daily charts with strong volumes. The stock has given a healthy breakout of horizontal resistance trend line adjoining October 27 and December 8, 2022.
Here's what Rajesh Palviya of Axis Securities recommends investors should do with these stocks when the market resumes trading today:
The stock is in a strong up trend and after forming a high of Rs 980 it gets into consolidation. It forms a descending triangle pattern and holds above 38 percent Fibonacci retracement of rally from Rs 505-980 placed at Rs 800.
On a weekly chart, the stock breaks above the descending triangular pattern with strong bullish candle, indicating a positive momentum. The daily and weekly strength indicator RSI (relative strength index) is in bullish mode and weekly RSI crosses above reference line which generated a buy signal.
Investors should buy, hold and accumulate this stock with an expected upside of Rs 1,000-1,100, with downside support zone of Rs 800 levels.
The stock was in a down trend after forming a high of Rs 742. It forms a bottom around Rs 200 and forms an Inverted Head and Shoulder reversal pattern. The stock has broken above a neckline placed at Rs 360. This breakout was accompanied with huge volumes indicating increased participation at breakout level.
The weekly strength indicator RSI is in positive terrain and sustaining above the reference line as well as the 50 mark indicating positive momentum.
Investors should buy, hold and accumulate this stock with an expected upside of Rs 550-600 with downside support of Rs 300.
General Insurance Corporation of India
On the weekly chart, the stock breaks above the rounded bottom pattern which was placed at Rs 150. This breakout is accompanied with huge volumes indicating increased participation. It is holding above key averages of 20, 50, 100 and 200-day SMA (simple moving average) indicating positive trend on the stock.
The stock is forming a higher high-low pattern on the daily chart indicating positive trend. The weekly strength indicator RSI is in positive terrain and sustaining above the reference line as well as the 50 mark indicating positive momentum.
Investors should buy, hold and accumulate this stock with an expected upside of Rs 240-270 with downside support of Rs 140.
Disclaimer: The views and investment tips expressed by investment experts on Moneycontrol.com are their own and not those of the website or its management. Moneycontrol.com advises users to check with certified experts before taking any investment decisions.
Discover the latest business news, Sensex, and Nifty updates. Obtain Personal Finance insights, tax queries, and expert opinions on Moneycontrol or download the Moneycontrol App to stay updated!