Shabbir Kayyumi
What is Double Bottom Pattern?
The Double Bottom pattern is a bullish reversal pattern. It is made up of two consecutive troughs that are roughly equal, with a moderate peak in-between. The double bottom looks like the letter "W". The twice-touched low is considered a support level.
The double bottom pattern always follows a major or minor downtrend in particular security and signals the reversal and the beginning of a potential uptrend.
Why buy Ashok Leyland?
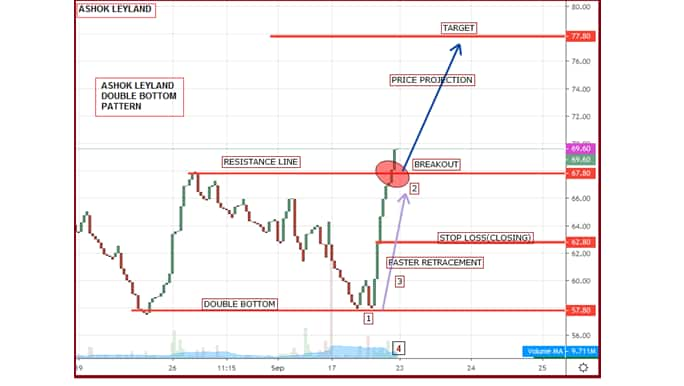
A double bottom reversal pattern forms after a downtrend, and its completion marks a trend reversal to an uptrend. The trend line is the most important component of double bottom pattern, a sustained trade above resistance line is considered as a breakout.
Ashok Leyland closed above major resistance levels of 67 in the last week. The recent formation of the double bottom pattern has given a breakout by trading above 67.80 marks which suggest buying in the stock for higher targets of 77.80.
Faster retracement after forming a second swing bottom is a sign of bottoming out the formation and a positive close above yesterday’s high gives additional confirmation. Decent volume participation in the past week is also giving support to double bottom pattern.
Double Bottom pattern and buy signal on Ashok Leyland Buy Signal:
1. Recent two swing bottoms are almost equal in price indicating the proper formation of double bottom pattern; however trading above 67.80 marks has given additional confirmation for strong bulls.
2. Recent close prices (69) are trading above the breakout line (67.80) of double bottom pattern indicating trend reversal to an uptrend.
3. Faster retracement after forming second swing bottom gives additional confirmation in pattern breakout.
4. Decent volume participation is also giving additional confirmation.Profit Booking:
Target as per Double Bottom pattern is calculated by adding the height of trough to resistance line which comes to 77.80, however one can book profits near previous swing high which is around 74.50.
Stop Loss:
Entire bullish view negates on breaching of mid-point of the entire valley on a closing basis and one should exit from a long position. In the case of Ashok Leyland, it is placed around 62.70 levels.
Conclusion
We recommend buying Ashok Leyland around Rs 67.80 with a stop loss of Rs 62.80 for higher targets of Rs 77.80 as indicated in the above chart.
The Author is Head - Technical & Derivative Research, Narnolia Financial Advisors.
Disclaimer: The views and investment tips expressed by investment expert on Moneycontrol.com are his own and not that of the website or its management. Moneycontrol.com advises users to check with certified experts before taking any investment decisions.

Discover the latest business news, Sensex, and Nifty updates. Obtain Personal Finance insights, tax queries, and expert opinions on Moneycontrol or download the Moneycontrol App to stay updated!