
Rohan Patil, Technical Analyst at Bonanza Portfolio
After a stellar upside move, the benchmark Nifty50 is consolidating within a very narrow range over the last three trading sessions and taking immediate resistance at 17,400 levels.
The momentum oscillator RSI (relative strength index 14) reading in a higher high higher bottom formation from 30 levels has reached near its overbought zone which is 70 levels and the slope of the oscillator has started to move lower like an inverted scallop pattern on the daily time frame.
The distance between the 21 EMA (exponential moving average) which is placed at 16,640 and prices has increased and we may find a corrective move to reduce the distance. In the past six trading days, Nifty has witnessed two gap up openings without any correction and both the gaps are unfiled. So there are chances prices may give a throwback towards that level.
The immediate support for the Nifty is placed at 17,100 and below those 16,800 levels. The upside resistance is capped near 17,600 & 17,800 levels.
On the daily chart, Bank Nifty has formed a Bearish Shark Harmonic Pattern on the daily time frame and prices are trading near its PRZ (potential reversal zone) levels and the momentum oscillator RSI (14) is reading at the overbought levels. The immediate support for the Bank Nifty is placed at 37,200 and below those 37,000 levels. The upside resistance is capped at 38,500 levels.
Here are two buy calls for next 2-3 weeks:
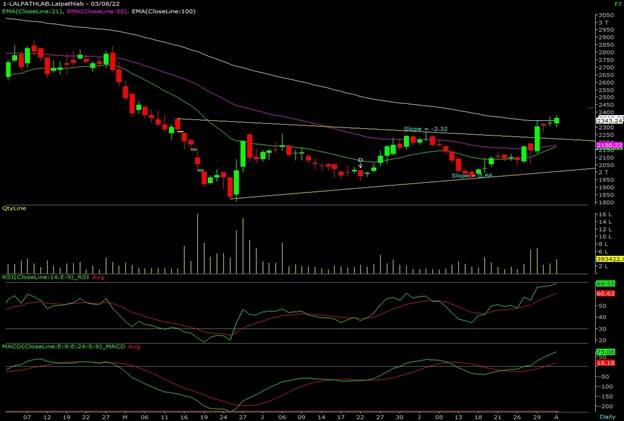
Dr Lal PathLabs: Buy | LTP: Rs 2,358.95 | Stop-Loss: Rs 2,264 | Target: Rs 2,489 | Return: 5.50 percent
The prices witnessed an ascending triangle pattern breakout on July 29 which was placed above Rs 2,250 levels in the daily time frame. After breakout, prices are showing a gradual upside movement in a small steep formation.
The prices are also sustained above 21-day exponential moving average which is placed at Rs 2,170 levels. The counter is also trading near the upper band of the Bollinger band indicating a possible continuation of the uptrend after the recent consolidation.
Momentum oscillator RSI (14) has given a trend line breakout which is placed at 60 levels with bullish crossover on the daily time frame. MACD (moving average convergence and divergence) indicator has crossed above its line of polarity.
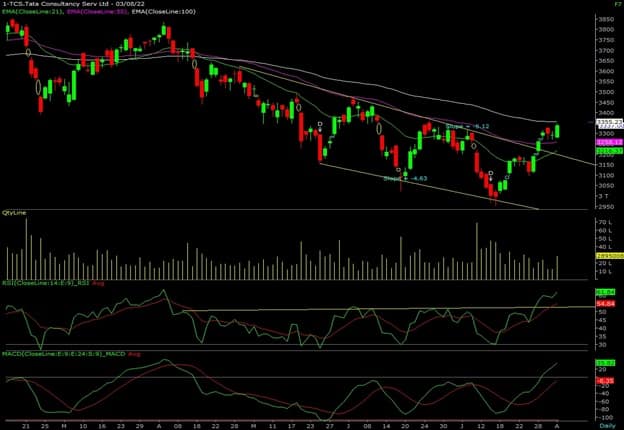
Tata Consultancy Services (TCS): Buy | CMP: Rs 3,339.5 | Stop-Loss: Rs 3,205 | Target: Rs 3,525 | Return: 5.60 percent
The prices witnessed a falling channel pattern breakout on July 28 which was placed above Rs 3,240 levels the daily time frame. After breakout, prices are moving higher without any pause which indicates a strong momentum in the ongoing trend.
The prices are also sustained above 21 & 50 day exponential moving average which is placed at Rs 3,216 and Rs 3,258 levels. The counter is also trading near the upper band of the Bollinger band indicating a possible continuation of the uptrend after the recent breakout.
Momentum oscillator RSI (14) has given a trend line breakout which is placed at 52 levels with bullish crossover on the daily time frame. MACD indicator has crossed above its line of polarity.
Disclaimer: The views and investment tips expressed by investment experts on Moneycontrol.com are their own and not those of the website or its management. Moneycontrol.com advises users to check with certified experts before taking any investment decisions.

Discover the latest business news, Sensex, and Nifty updates. Obtain Personal Finance insights, tax queries, and expert opinions on Moneycontrol or download the Moneycontrol App to stay updated!