


The market closed lower for the first time in last four weeks with the benchmark indices losing more than 1 percent in the week ended April 21, majorly dented by a selling pressure in technology stocks.
The Nifty50 fell more than 200 points to close at 17,624 and formed a bearish engulfing pattern on the weekly scale, which is a negative sign, but the index managed to hold on to the 17,600 level, despite correction and volatility. Also on an intraday basis, it has taken a support at 200-day EMA (exponential moving average - 17,530), while on the higher side, it has faced resistance at the 17,700 levels.
These levels are expected to be crucial for further direction of the Nifty50 going forward and, if the index manages to hold 17,500-17,600 area, then 18,000 can be a possibility in coming sessions, experts said.
"Amid the price-wise correction in the market, the chart structure construes optimism, and it is highly anticipated to continue the cheerful run in the upcoming week," Osho Krishan, Senior Analyst - Technical & Derivative Research at Angel One, said.
As far as levels are concerned, he feels that till the index firmly withholds the pivotal support of 17,500, there is no sign of caution in the market, whereas on the higher end, 17,700-17,800 holds stiff resistance and a decisive move beyond which could trigger the next leg of rally in the comparable period.
Mitesh Karwa, research analyst at Bonanza Portfolio, also feels the Nifty50 is expected to trade with a bullish-to-sideways bias in the coming week as the bulls are absorbing every dip in the market. The coming couple of weeks are of extreme importance as they will decide the trend for the next leg, he said.
Highest open interest is at 17,700 strike on the Call side and 17,600 on the Put side and till the time Nifty is in this range, it is expected to remain sideways, he added.
Given the ongoing earnings season, Osho Krishan expects strong moves in the broader markets. Hence, one needs to have a stock-centric approach for better trading opportunities, he advised.
Let's take a look at the top 10 trading ideas by experts for the next three-four weeks. Returns are based on the April 21 closing prices:
Expert: Shrikant Chouhan, Head of Equity Research (Retail) at Kotak Securities
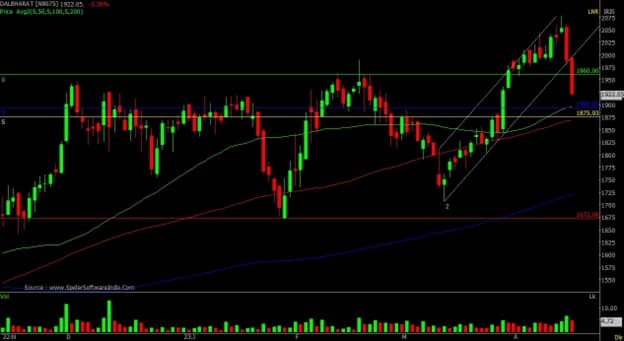
Dalmia Bharat: Buy | LTP: Rs 1,922 | Stop-Loss: Rs 1,820 | Target: Rs 2,150 | Return: 12 percent
There is a strong uptrend in the stock. It is forming a series of rising tops and rising bottoms. Based on it our strategy should be to buy on dips at key support levels. It has also displayed a strong rally in the last 20 to 23 trading sessions between Rs 1,760 to Rs 2,078 levels, which is around 18 percent.
In the last 3 days, the stock has come back to Rs 1,922 level, which is about 8 percent. Buy the stock at current levels and more on dips at Rs 1,875, with a stop-loss at Rs 1,820. On the upside, hurdles could lie at Rs 2,050 and Rs 2,150.
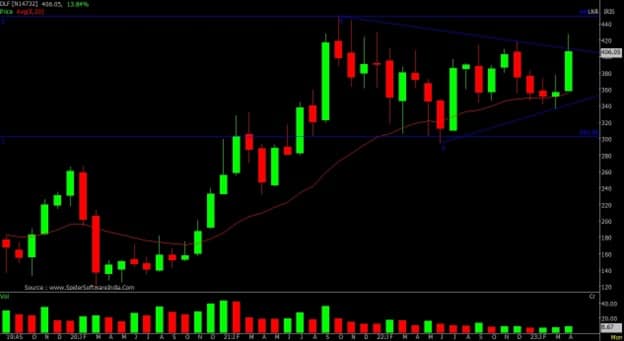
DLF: Buy | LTP: Rs 406 | Stop-Loss: Rs 370 | Target: Rs 500 | Return: 23 percent
During the pandemic period, the stock fell to Rs 114, however, from those levels the stock bounced to Rs 450 levels in a span of 19 months. Since then it has since entered a corrective mode that lasted for 18 months, indicating the completion of the correction and a fresh start.
Depending on the formation, the stock may move towards Rs 500 and Rs 600 levels in the next 6 to 12 months. The strategy should be to buy between Rs 410 and Rs 390 levels.
The current momentum will fade if it breaks Rs 370 level, which should be the stop-loss for the positional trade.
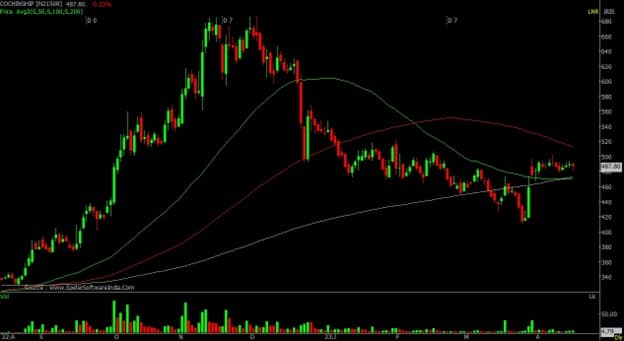
Cochin Shipyard: Buy | LTP: Rs 488 | Stop-Loss: Rs 465 | Target: Rs 550 | Return: 13 percent
The stock is forming a Pole and Flag formation on the daily chart. It was at Rs 410 and moved sharply to Rs 496 in the current uptrend of the market, however, in the last 10/12 days, the stock started consolidating in a rectangle trading range, indicating (flag) continuation formation.
Above Rs 505, which is the highest point of the formation, the stock may move towards Rs 550 with minor resistance at Rs 525. Buying is advised at Rs 490 & Rs 480, with a stop-loss at Rs 465.
Expert: Vinay Rajani, Senior Technical and Derivative Analyst at HDFC Securities
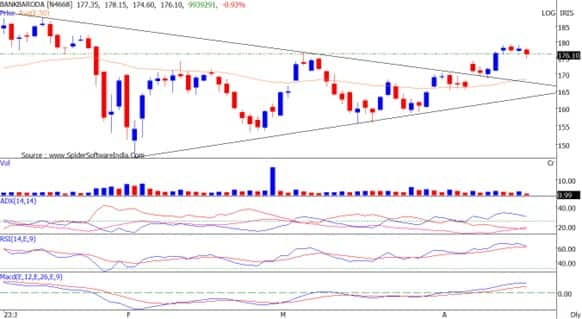
Bank of Baroda: Buy | LTP: Rs 176.45 | Stop-Loss: Rs 167 | Targets: Rs 187-202 | Return: 14 percent
The stock price is trading within the big symmetrical triangle, which adjoins major swing highs and lows since December 2022. The stock is on the verge of breaking out from the symmetrical triangle.
The chances of bullish breakout is higher as the stock has been forming higher tops and higher bottoms on daily chart.
Primary trend of the PSU bank index is bullish, as it has been holding above its 200-day EMA (exponential moving average). Indicators and oscillators like RSI (relative strength index), MACD (moving average convergence divergence) and DMI (directional movement index) have turned bullish on daily charts.
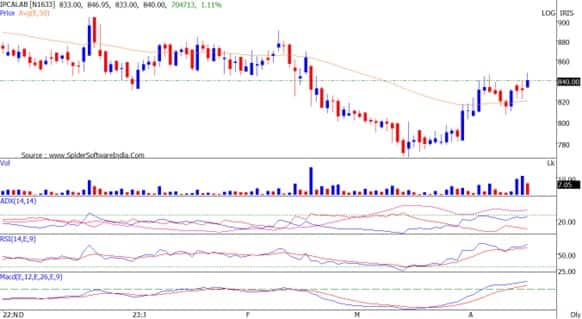
Ipca Laboratories: Buy | LTP: Rs 840.65 | Stop-Loss: Rs 767 | Targets: Rs 898-930 | Return: 11 percent
On month ended March 2023, the stock price formed “Doji” reversal pattern on its monthly chart. Formation of Doji has seen after healthy fall of 44 percent in the stock price.
Stochastics oscillator has exited the oversold zone on the monthly charts, which indicates trend reversal. The stock price has recently surpassed 50-day EMA resistance placed at Rs 818 odd levels.
On the daily chart, stock price has broken out from bullish “Flag” pattern.
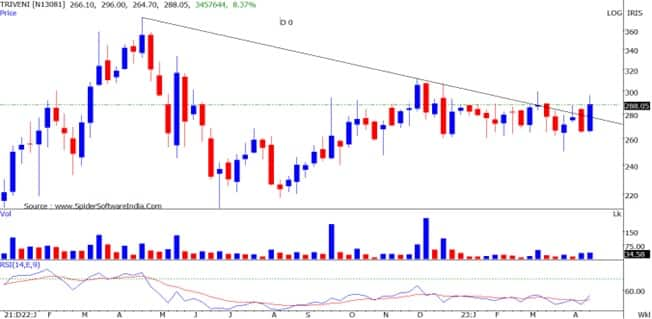
Triveni Engineering: Buy | LTP: Rs 289 | Stop-Loss: Rs 272 | Targets: Rs 310-330 | Return: 14 percent
The stock has broken out from downward sloping trendline on the weekly chart. Stock has been finding support on its 200-day EMA. The stock has broken out from bullish Inverted Head and Shoulder pattern on the daily chart.
Indicators and oscillators have turned bullish on weekly chart.
Expert: Ruchit Jain, Lead Research at 5paisa.com
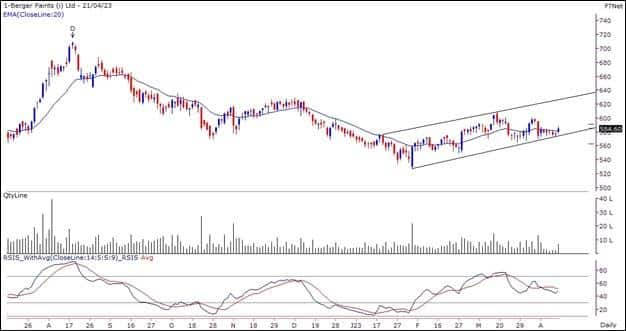
Berger Paints: Buy | LTP: Rs 585 | Stop-Loss: Rs 565 | Target: Rs 628 | Return: 7 percent
This stock went through a corrective phase from July 2021 to February 2023. But in last couple of months, prices have seen a gradual upmove and have started forming a ‘Higher Top Higher Bottom’ structure again.
Paint stocks usually have an inverse correlation with crude prices and since the latter is showing signs of correction in the short term, it should lead to a positive impact on this sector.
Hence, positional traders can buy this stock around current market price of Rs 585 for potential targets of Rs 605 and Rs 628. The stop-loss for long positions should be placed below Rs 565.
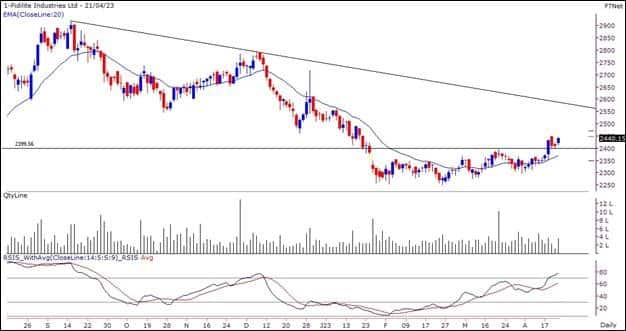
Pidilite Industries: Buy | LTP: Rs 2,440 | Stop-Loss: Rs 2,380 | Target: Rs 2,540 | Return: 4 percent
Post a price-wise corrective phase, the stock consolidated in a range in last few weeks. The stock has given a breakout from this consolidation indicating probability of a pullback move in the short term.
The RSI oscillator is hinting at a positive momentum and hence we expect a gradual upmove in the stock in the near term.
Short Term traders can look to buy the stock in the range of Rs 2,440-2,420 for potential targets around Rs 2,500 and Rs 2,540. The stop-loss for long positions should be placed below Rs 2,380.
Expert: Mitesh Karwa, Research Analyst at Bonanza Portfolio
Mahindra Holidays & Resorts India: Buy | LTP: Rs 301 | Stop-Loss: Rs 270 | Target: Rs 335 | Return: 11 percent
The stock has taken support from an upwards sloping trendline and is trading in a higher high higher low formation on the weekly timeframe whereas on the daily timeframe the stock has recently broken out of a pattern and is trading above important EMA’s of 20/50/100/200 which can be used as a confluence towards the bullish view.
On the indicator front, the supertrend indicator is indicating a bullish continuation on the daily timeframe and the Ichimoku cloud is also suggesting a bullish move as the price is trading above the conversion and base line on the daily timeframe.
Momentum oscillator RSI (14) is at around 67 on the daily time frame indicating strength by sustaining above 50 and observation of the above factors indicates that a bullish move in MHRIL is possible for targets upto Rs 335.
One can initiate a buy trade in between the range of Rs 295-300, with a stop-loss of Rs 270 on daily closing basis.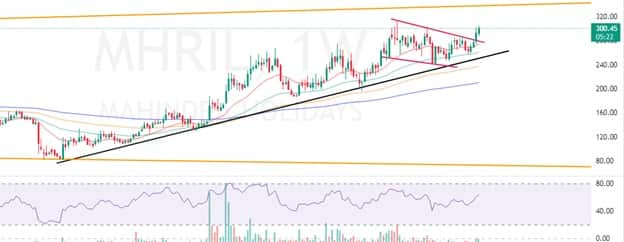
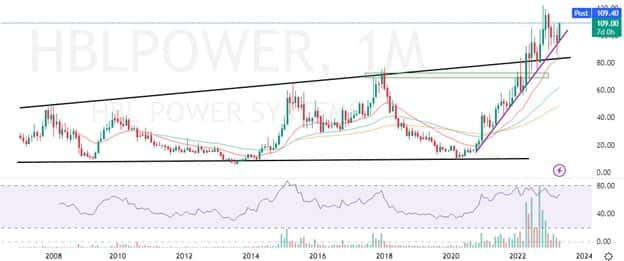
HBL Power Systems: Buy | LTP: Rs 109 | Stop-Loss: Rs 94 | Target: Rs 130 | Return: 19 percent
HBL Power has seen breaking out of a broadening wedge pattern on the monthly timeframe after 15 years with above average volumes. On the indicator front the stock is trading above important EMA’s of 20/50/100/200 which indicates bullishness, and the supertrend indicator is indicating a bullish continuation.
The momentum oscillator RSI (14) is at around 69 on the daily time frame indicating strength by sustaining above 50 and the ichimoku cloud is also suggesting a bullish move as the price is trading above the conversion and base line on the daily timeframe.
Observation of the above factors indicates that a bullish move in HBL Power is possible for targets upto Rs 130. One can initiate a buy trade in the range of Rs 107-109, with a stop-loss of Rs 94 on daily closing basis.
Apollo Pipes: Buy | LTP: Rs 598.55 | Stop-Loss: Rs 550 | Target: Rs 650 | Return: 8.6 percent
Apollo Pipes has seen breaking out of a symmetrical triangle pattern on the weekly timeframe with above average volumes and has closed above the highs of last one year with a bullish candlestick on the daily timeframe.
The supertrend indicator is also indicating a bullish continuation which supports the bullish view. Momentum oscillator RSI (14) is at around 64 on the daily time frame indicating strength by sustaining above 50 and the Ichimoku Cloud is also suggesting a bullish move as the price is trading above the conversion and base line.
Observation of the above factors indicates that a bullish move in Apollo Pipes is possible for targets upto Rs 650. One can initiate a buy trade in between the range of Rs 593-597 with a stop-loss of Rs 550 on daily closing basis. 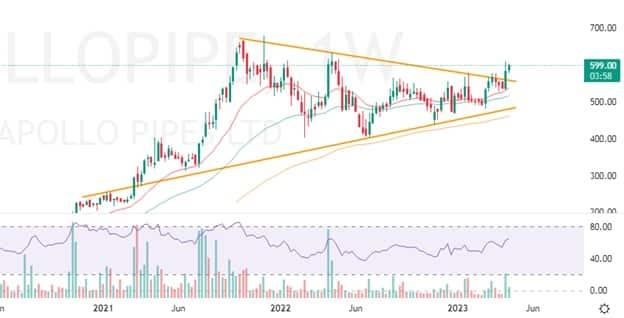
Disclaimer: The views and investment tips expressed by investment experts on Moneycontrol.com are their own and not those of the website or its management. Moneycontrol.com advises users to check with certified experts before taking any investment decisions.
Discover the latest business news, Sensex, and Nifty updates. Obtain Personal Finance insights, tax queries, and expert opinions on Moneycontrol or download the Moneycontrol App to stay updated!


