

The Nifty50 reclaimed its record high of 18,604 at last after more than 13 months, continuing an uptrend for the fifth straight session on November 28 and maintained higher highs for the fourth session in a row.
There was also a breakout of long, slightly downward sloping resistance trendline adjoining October 19, 2021 and November 25, 2022. On a weekly basis, it has consistently maintained higher high formation for seventh consecutive week.
The momentum is in favour of bulls but having consistent run-up for the last few days, there could be some bouts of volatility and consolidation can be seen in coming sessions, before taking gradual march towards 18,700-19,000, with immediate support at 18,500 and crucial support at 18,300-18,000 levels, experts said.
"We expect the Nifty to gradually march towards 19,000 mark, as the overall trend remains positive. Participation of the broader market further adds strength to the market," Siddhartha Khemka, Head of Retail Research at Motilal Oswal Financial Services, said.
However, intermittent volatility cannot be ruled out on account of global worries, he feels.
The Nifty has shown real resilience and has outperformed by a big margin point to point. This has given a rise in probability that the index may touch the extrapolated levels of 19,600 (2,800 points mirror from the recent bottom at 16,800), Pushkaraj Kanitkar, VP Equities at GEPL Capital, said. "The view would be negated only below the level of 17,800."
Here are top 10 stock ideas by experts that can participate in the Nifty's journey towards the 19,000 mark:
Expert: Jigar S Patel, Senior Manager - Equity Research at Anand Rathi
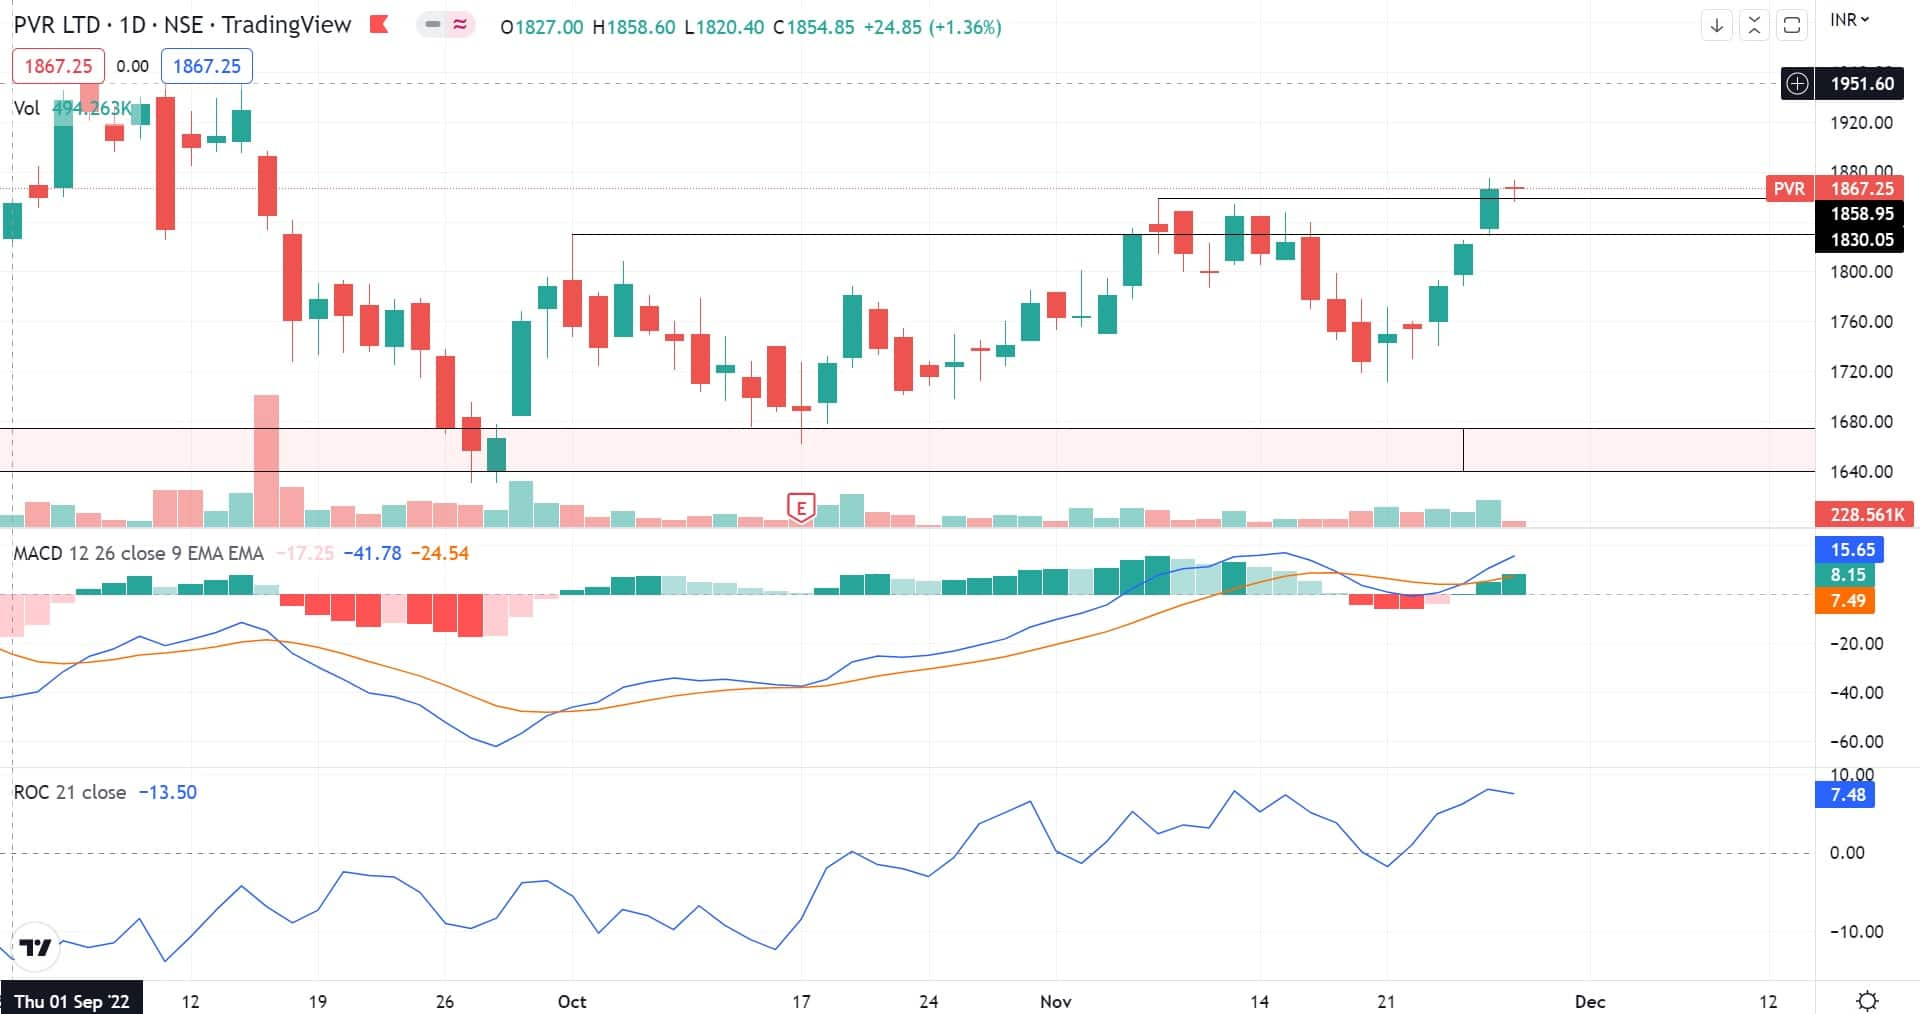
PVR: Buy | LTP: Rs 1,867 | Stop-Loss: Rs 1,795 | Target: Rs 2,000 | Return: 7 percent
Since the last 3 trading sessions, the counter has witnessed nice buying interest along with volume picking up complementing the up move. At the current juncture, PVR has taken support at 200 DEMA (days exponential moving average) high low band along with pair of Doji candlesticks structure.
Recently PVR has taken out its previous swing high of Rs 1,858 and has closed near the Rs 1,867 mark in its previous trading session.
On the indicator front, price ROC (rate of change) 21 days is well placed above the zero line around 8 levels along with daily MACD (moving average convergence and divergence) giving a bullish cross exactly above the zero line thus hinting towards Rs 2,000 levels in a month's time.
Plausible support is expected around Rs 1,795. One can buy in small tranches between Rs 1,860-1,870 and another at Rs 1,830 levels (if tested again).
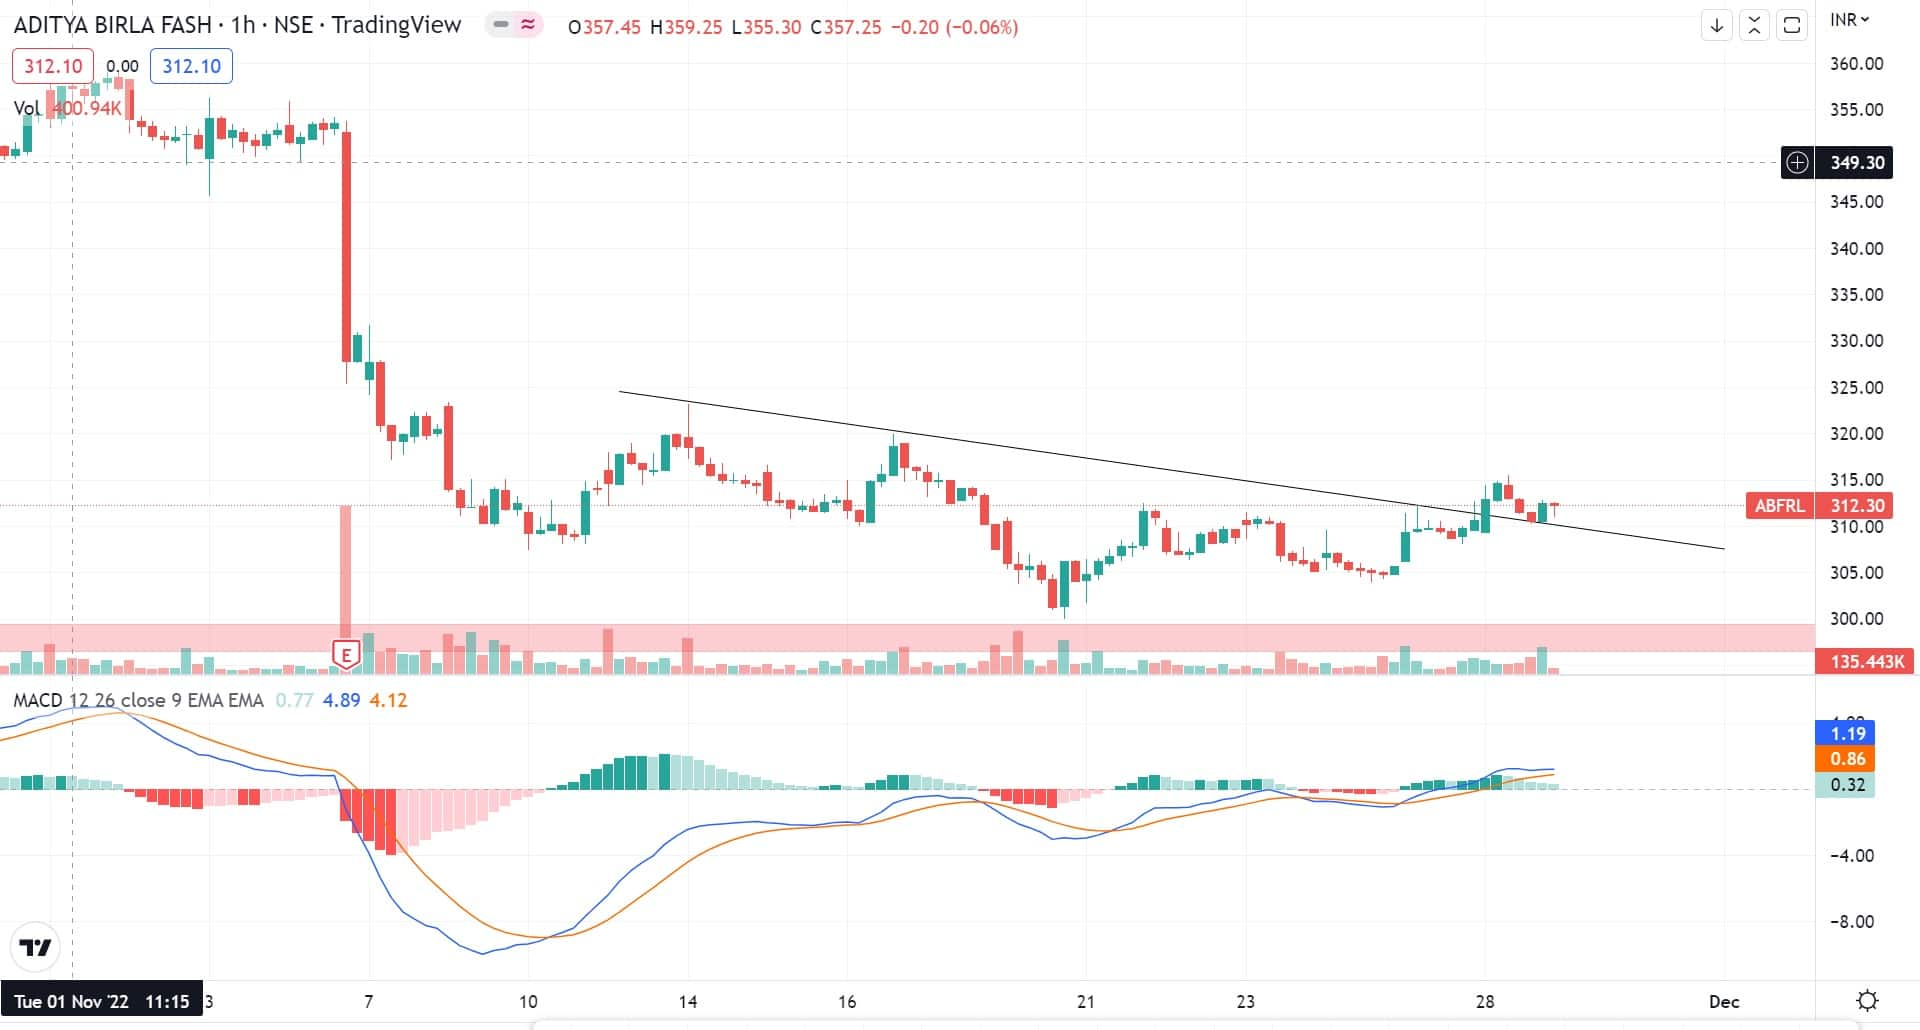
Aditya Birla Fashion & Retail: Buy | LTP: Rs 312 | Stop-Loss: Rs 290 | Target: Rs 340 | Return: 9 percent
The fall which started from November 1, 2022 till November 18, 2022 resulted in a 17 percent cut in price from the high of Rs 360. At the current juncture, the said counter is taking support near Rs 300 levels.
On an hourly scale, it has given a bullish crossover in the directional movement index along with an hourly MACD bullish cross thus confirming an upside in the counter. One can buy with an upside target of Rs 340 with a stop-loss of Rs 290.
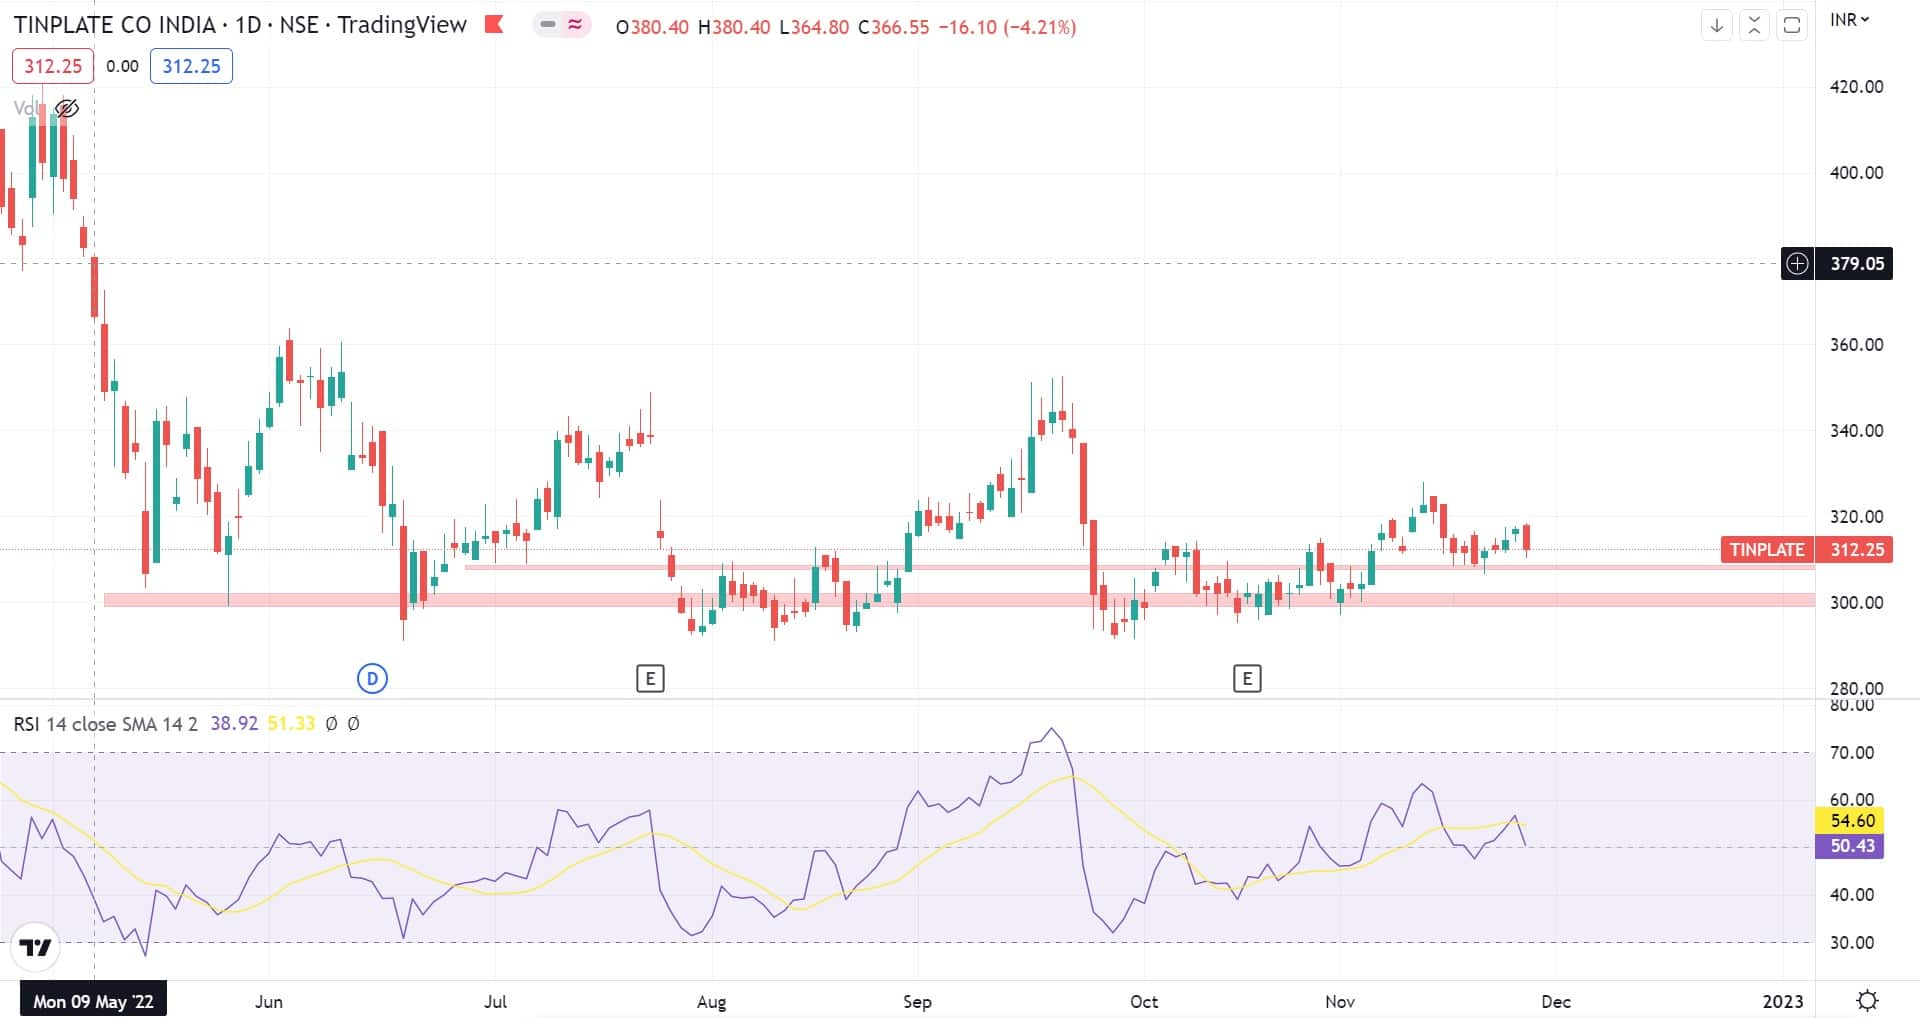
Tinplate Company of India: Buy | LTP: Rs 312 | Stop-Loss: Rs 290 | Target: Rs 350 | Return: 12 percent
Tinplate has corrected almost 34 percent from its top of Rs 438 which was registered on April 13, 2022. On a weekly scale, it has taken support near its previous historical support zone Rs 290-300.
In the last 4 months, it has made a nice base near Rs 300 levels. Recently on a daily scale, the stock confirmed a bullish Hammer candlestick pattern exactly at 200 DEMA high low band and that is adding more confirmation of further upside in the counter.
In addition to the above-discussed technical reasoning, weekly RSI (relative strength index) has nicely bounced back from Rs 40 levels which is adding more strength to the said counter. Thus we advise traders to buy the stock for an upside target of Rs 350 with a stop-loss of Rs 290.
Expert: Kunal Shah, Senior Technical Analyst at LKP Securities
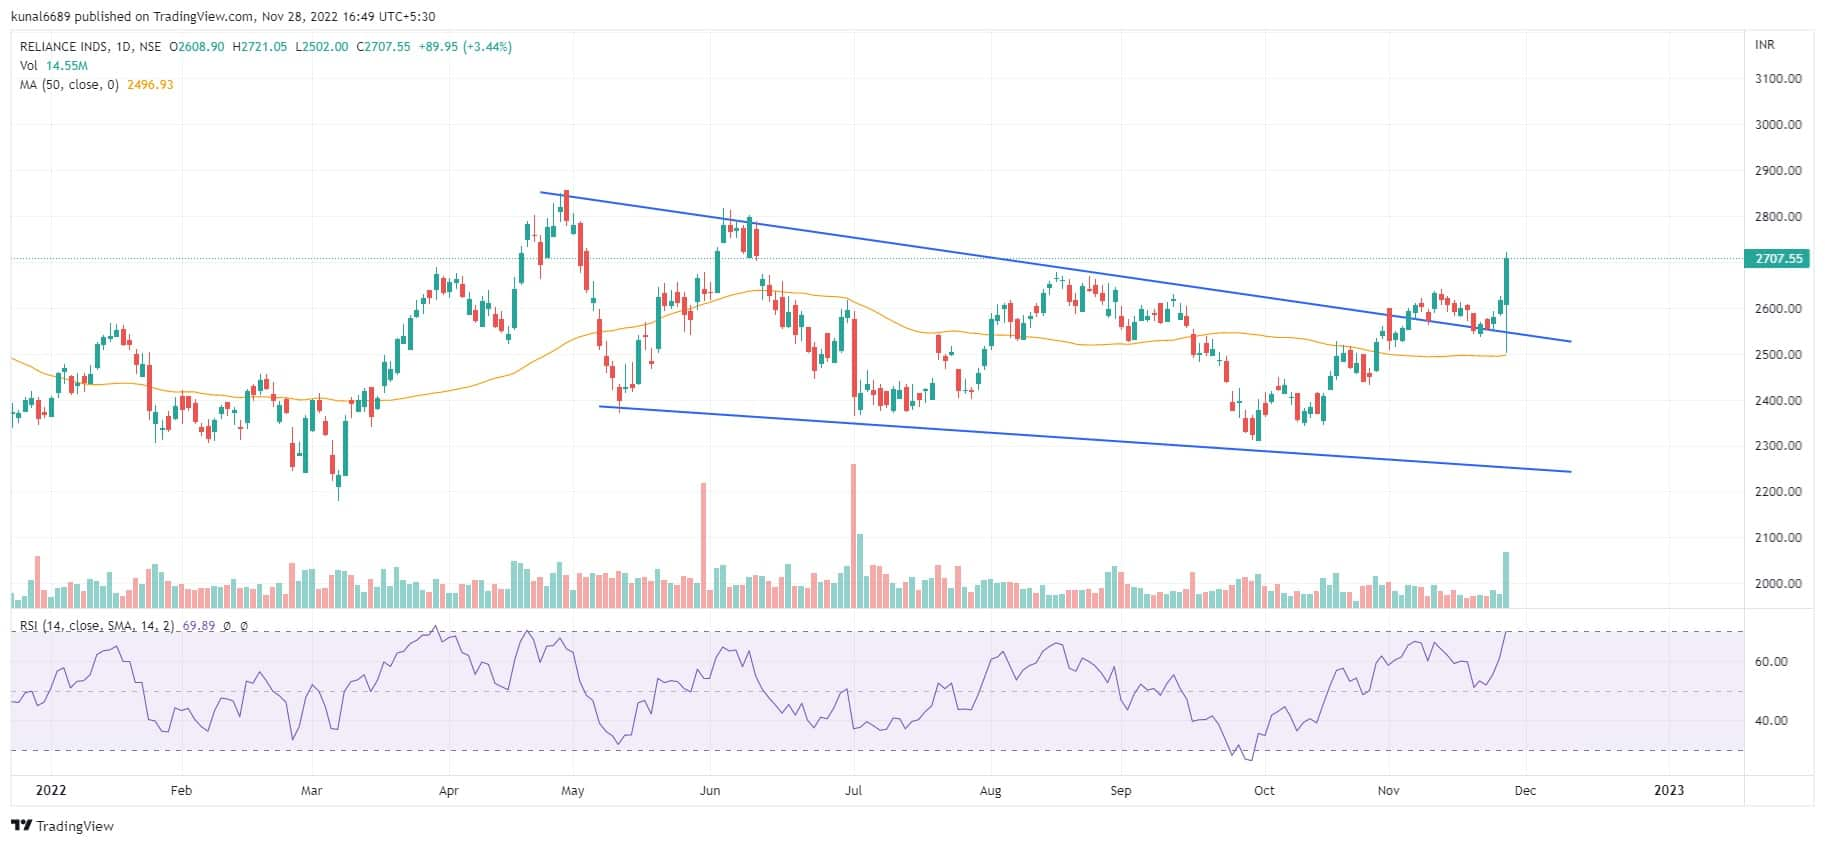
Reliance Industries: Buy | LTP: Rs 2,707.55 | Stop-Loss: Rs 2,600 | Target: Rs 2,800-2,920 | Return: 8 percent
The stock has given a strong breakout on the daily chart from a falling trend line with a sharp surge in volumes. The momentum indicator RSI has given a positive crossover on the daily chart which confirms the buy signal.
The stock bounced back sharply from its 200 EMA which is placed at Rs 2,500 level.
Nippon Life India: Buy | LTP: Rs 269.65 | Stop-Loss: Rs 260 | Target: Rs 285-290 | Return: 7.5 percent
The stock for the past couple of months had witnessed a sharp correction with lower high lower low formations. The stock is now witnessing a bottom formation on the daily chart with a sharp surge in volumes.
A positive divergence is visible on the daily chart which confirms the buy signal. The MACD indicator has also turned bullish with a positive crossover at the zero line confirming the change in trend.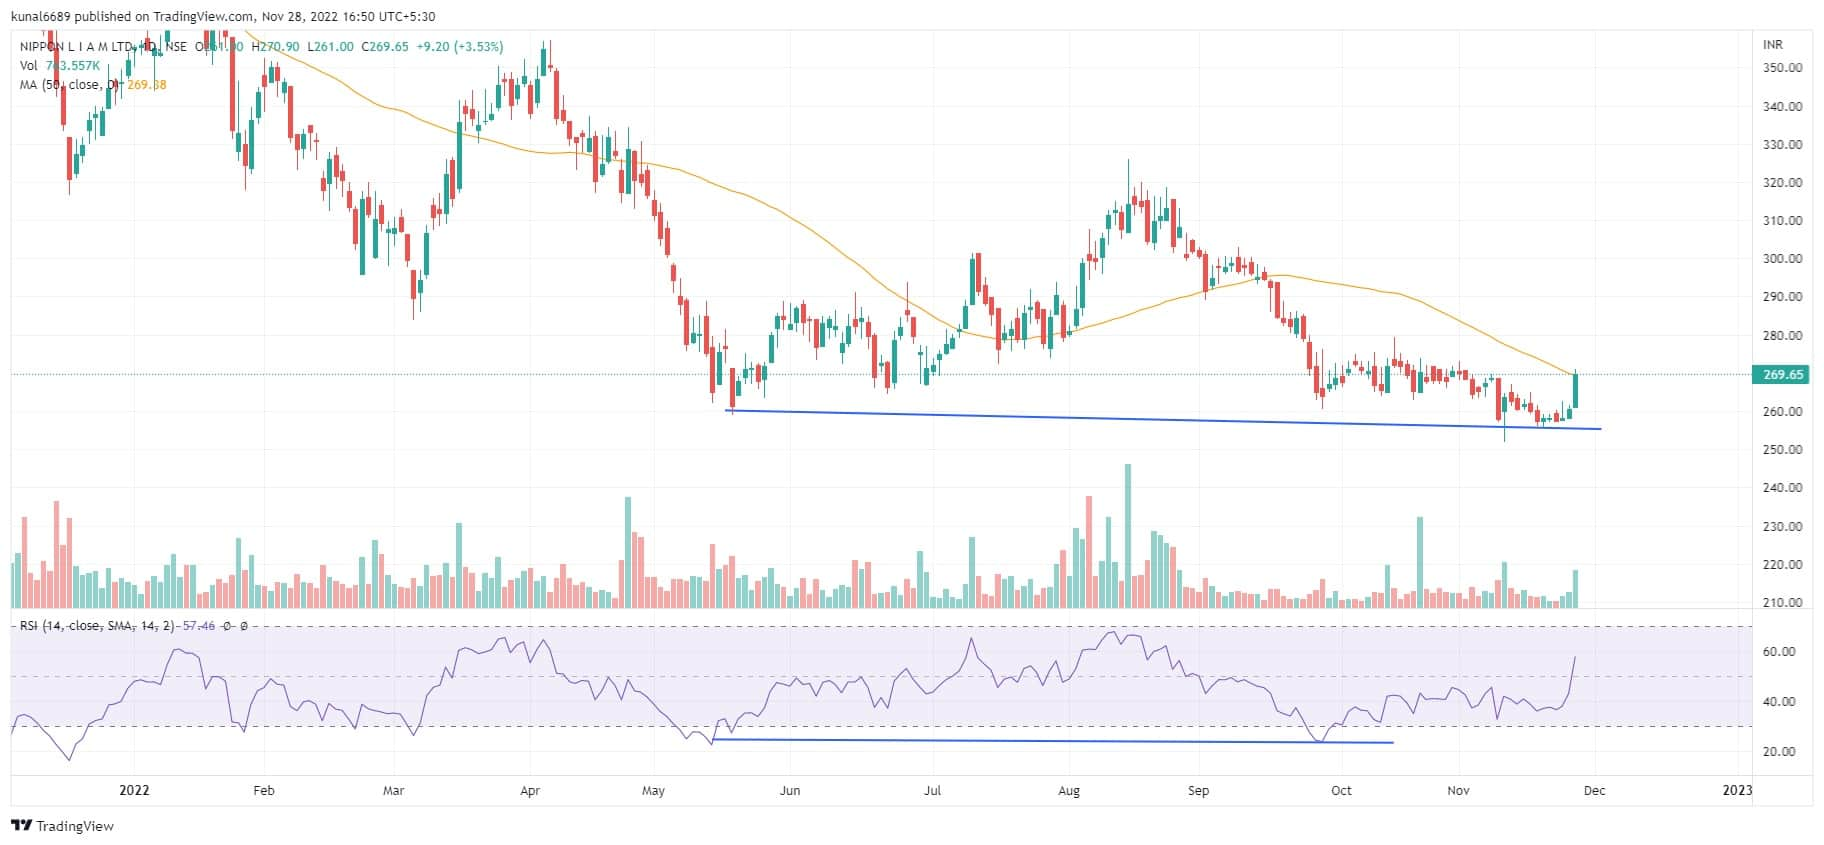
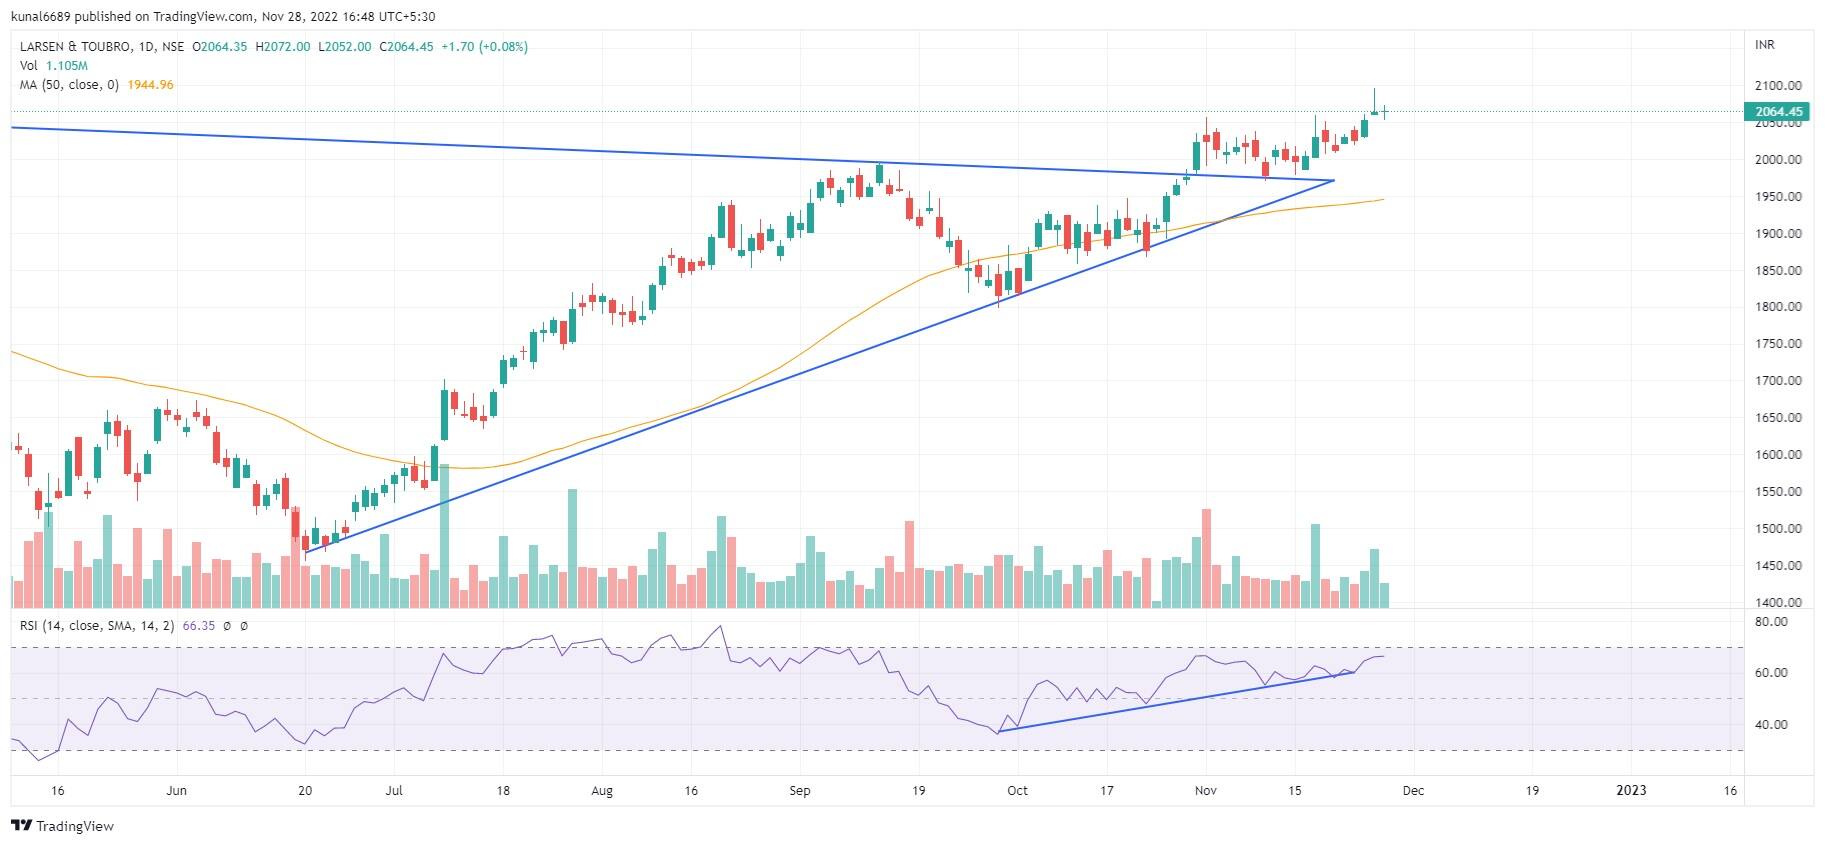
Larsen & Toubro: Buy | LTP: Rs 2,064.45 | Stop-Loss: Rs 1,950 | Target: Rs 2,200-2,240 | Return: 8.5 percent
The stock is trading in a strong uptrend with higher top and higher bottom formations on all the time frames. The momentum indicator RSI has entered the zone of 60 which confirms the strength of the stock.
The stock is trading well above its short-term moving average which will act as support. The lower-end support zone Rs 1,980-1,950 will act as a cushion for the bulls and the upside visible targets are Rs 2,200-2,240.
Expert: Pushkaraj Kanitkar, VP Equities at GEPL Capital
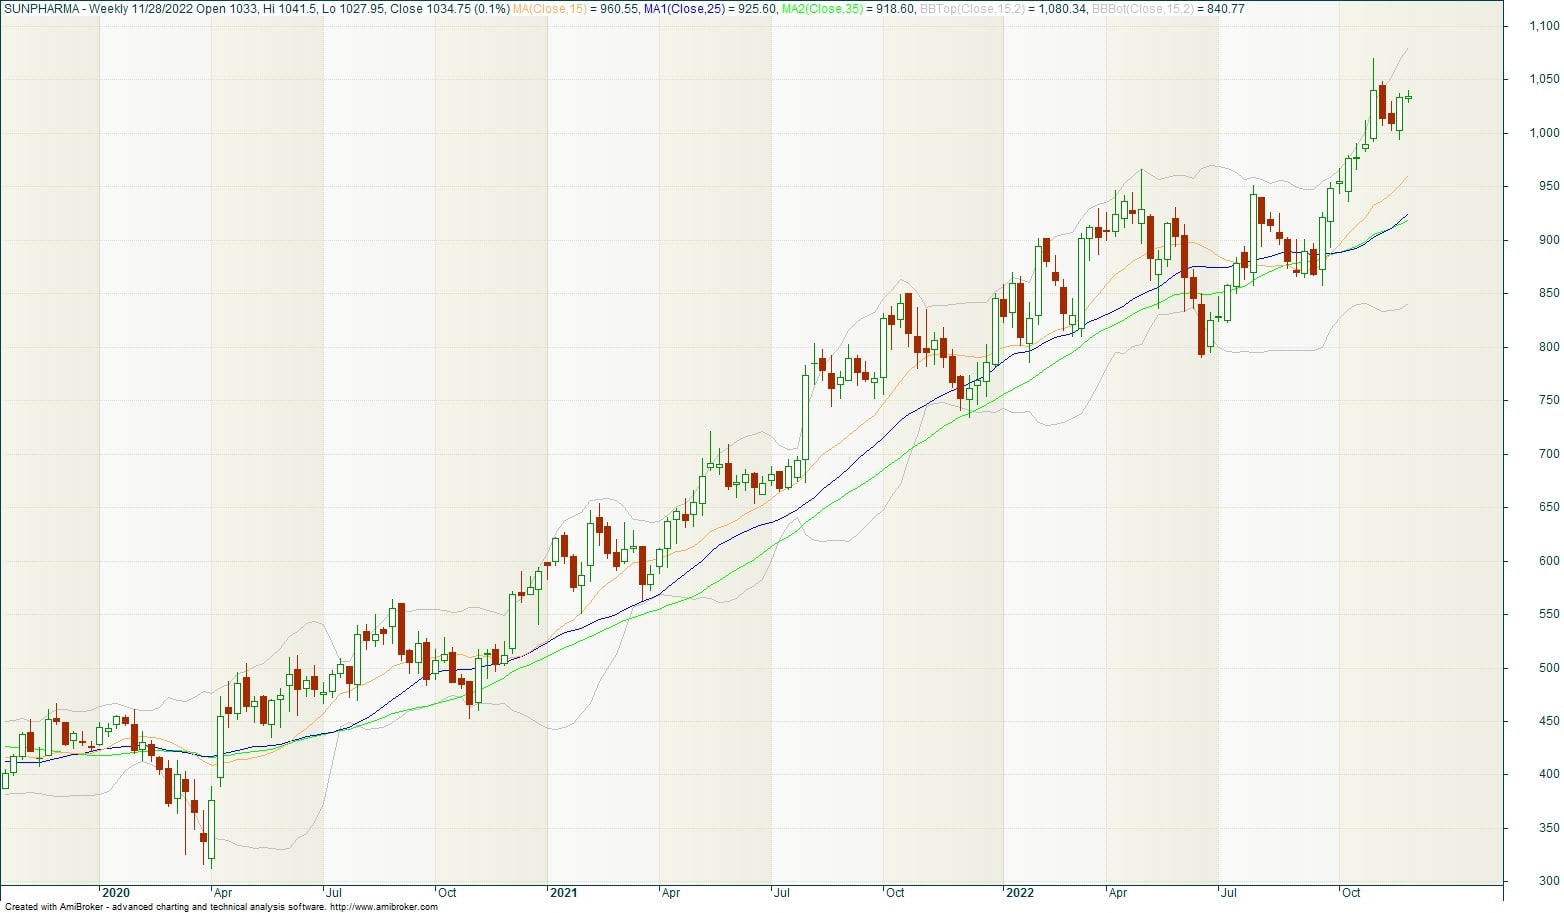
Sun Pharma: Buy | LTP: Rs 1,034.75 | Stop-Loss: Rs 925 | Target: Rs 1,200 | Return: 16 percent
Although belonging to the laggard sector (pharma and healthcare), Sun Pharma has remained a consistent performer right from the March 2020 lows. Rising in a rational uptrend, the stock is in striking distance of all-time highs created in 2015 around the level of Rs 1,200.
The momentum in the stock seems pretty strong and hence we have seen strong outperformance with respect to the peers in the sector (Sun Pharma has moved up contrary to downmove in Nifty PHARMA Index.).
Immediate targets are placed at Rs 1,200 while negation of the view would happen below the level of Rs 925 (25-week DMA).
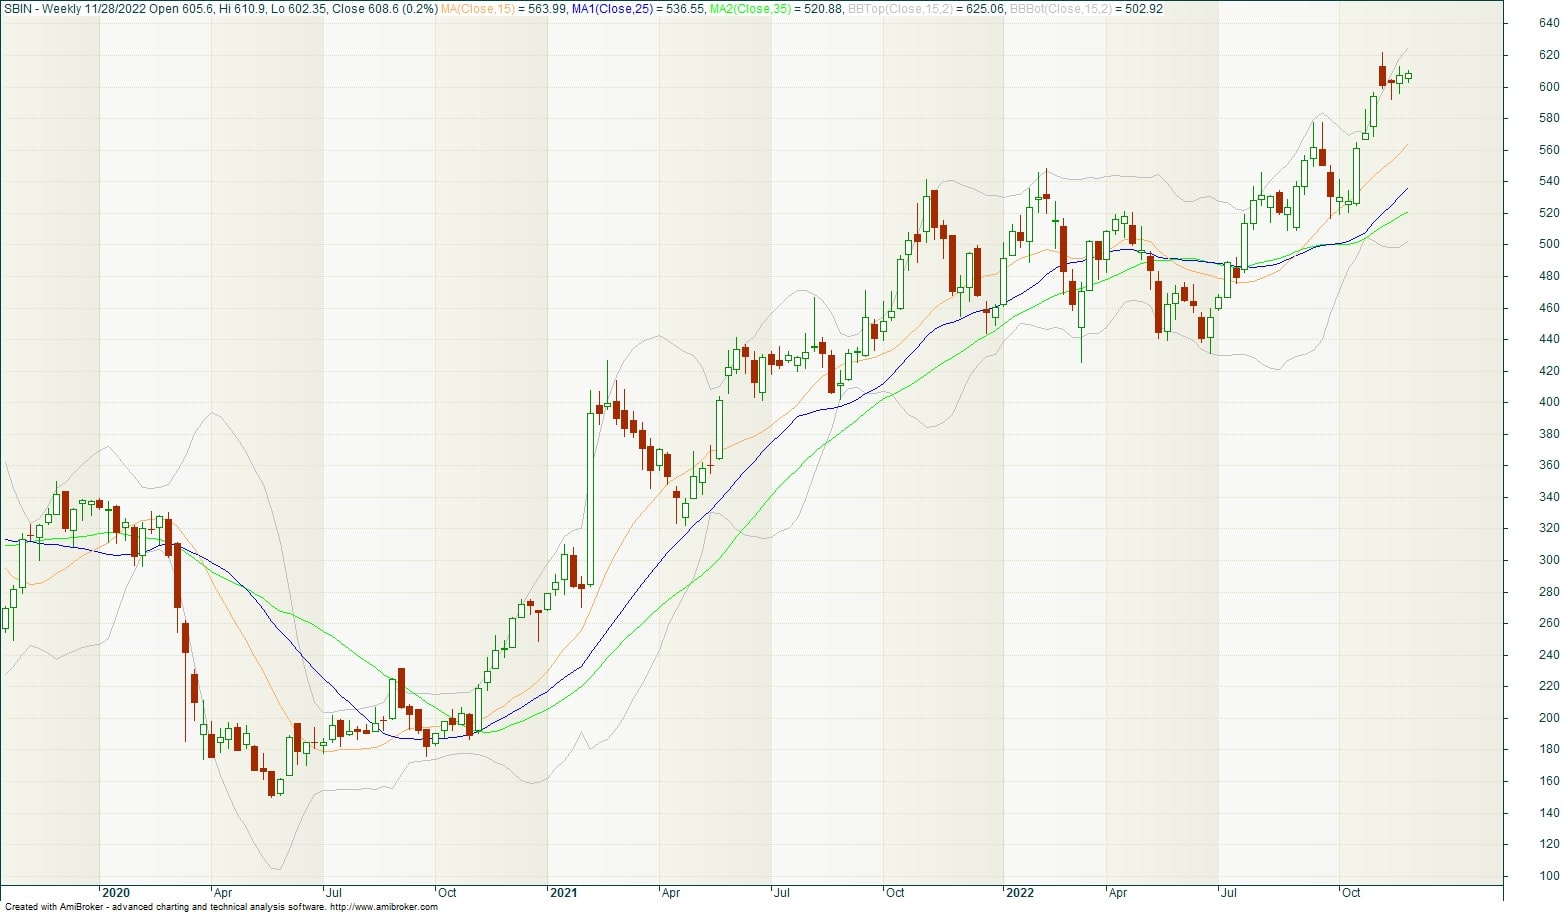
State Bank of India: Buy | LTP: Rs 608.6 | Stop-Loss: Rs 540 | Target: Rs 820 | Return: 35 percent
The stock belongs not just to the outperforming sector (Bank Nifty has created all-time highs way before the Nifty), but intrinsically has been outperformer within the sector (both private & PSU banks).
The prices created fresh highs although the heavyweights within the index like HDFC Bank (private) or Bank of Baroda, or Canara Bank (PSU banks) are still off the all-time highs.
The outperformance will open up price projection of patterns to around Rs 820, while the view will get negated below Rs 540, which was the level of earlier highs with multiple touch points.
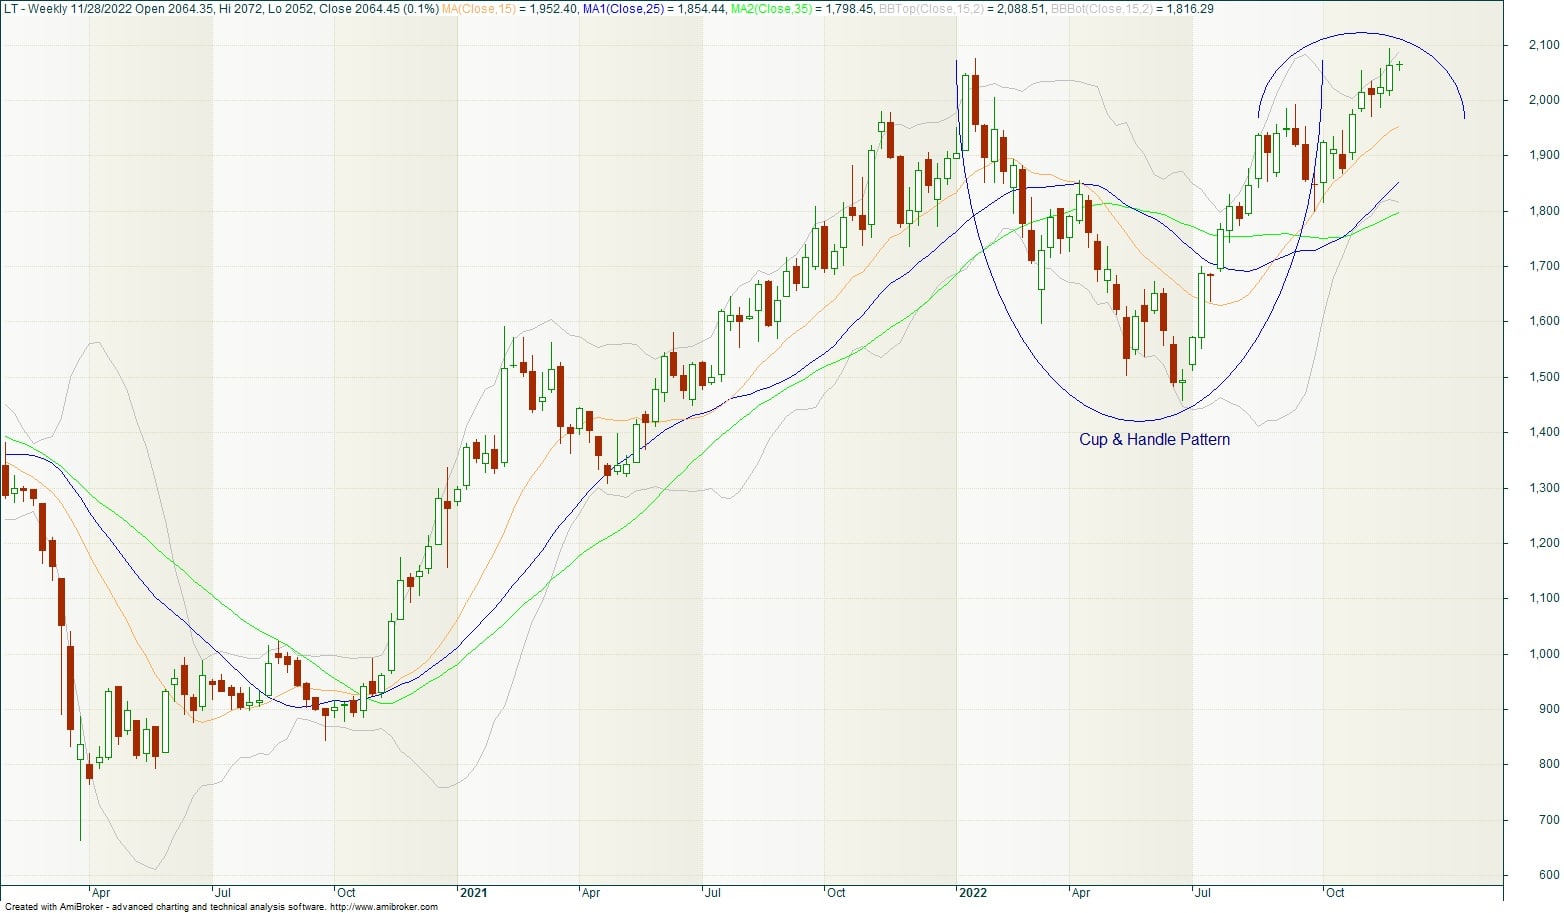
Larsen & Toubro: Buy | LTP: Rs 2,064.45 | Stop-Loss: Rs 1,800 | Target: Rs 2,350 | Return: 14 percent
In sync with the price movement since October 2021, we have seen L&T too touch new highs recently. In the process it has remained a strong contender for the leadership within the Nifty50.
Technically it has formed a continuation pattern in the form of Cup & Handle pattern. The price projection for the pattern points to levels of Rs 2350, which also happens to be the extrapolation from the recent swing low of Rs 1,800.
We stand bullish on the same with negation only below the swing low.
Expert: Rajesh Palviya, Vice President - Research (Head Technical & Derivatives) at Axis Securities
State Bank of India: Buy | LTP: Rs 608.6 | Stop-Loss: Rs 590 | Target: Rs 660-690 | Return: 13 percent
The stock is in a strong up trend forming a series of higher tops and bottoms across all the time frame. The stock is strongly placed above all its 20, 50, 100 and 200-day SMAs (simple moving average), and these averages are also inching upward along with rising prices. This signifies a strong up trend.
The daily, weekly, monthly relative strength indicator RSI is also placed positively representing sustained uptrend. In the weekly time frame, the stock managed to hold its prior breakout zone of Rs 560 levels which remains a positive sign.
Traders and investors are advised to add, and hold with expected upside of Rs 660-690 levels. An immediate support zone is around Rs 590 and major support zone Rs 570 levels.
Reliance Industries: Buy | LTP: Rs 2,707.55 | Stop-Loss: Rs 2,500 | Target: Rs 2,900-3,000 | Return: 11 percent
Since September 2021, the stock has been consolidating within broad trading range Rs 2,800-2,200 levels indicating strong accumulation. However on the monthly charts, the stock is in a strong uptrend forming a series of higher tops and bottoms
With current close, the stock has decisively broken out its "descending triangle" at Rs 2,640 levels. This breakout is accompanied with huge volumes indicating increased participation. The stock has recaptured its 20, 50, 100 and 200-day SMA and rebounded sharply. The daily and weekly RSI is placed positively, which supports rising strength.
Traders and investors are advised to add, and hold with expected upside of Rs 2,900-3,000 levels. An immediate support zone is around Rs 2,500 and major support zone Rs 2,350 levels.
Larsen & Toubro: Buy | LTP: Rs 2,064.45 | Stop-Loss: Rs 1,960 | Target: Rs 2,300-2,350 | Return: 14 percent
The stock is in strong uptrend across all time frames and registered a new all-time frame at Rs 2,095 levels. This represents bullish sentiments. On the weekly chart, the stock has confirmed "V" shape breakout at Rs 2,044 levels indicating continuation of uptrend.
The stock is strongly placed above all its 20, 50, 100 and 200 day SMAs, and these averages are also inching upward along with rising prices.
The daily, weekly, monthly and quarterly RSI is placed positively indicating sustained strength across all the time frames.
Traders and investors are advised to add, and hold with expected upside of Rs 2,300-2,350 levels. An immediate support zone is around Rs 1,960 and major support zone Rs 1,800 levels.
Disclaimer: The views and investment tips expressed by investment experts on Moneycontrol.com are their own and not those of the website or its management. Moneycontrol.com advises users to check with certified experts before taking any investment decisions.
Disclaimer: MoneyControl is a part of the Network18 group. Network18 is controlled by Independent Media Trust, of which Reliance Industries is the sole beneficiary.
Discover the latest business news, Sensex, and Nifty updates. Obtain Personal Finance insights, tax queries, and expert opinions on Moneycontrol or download the Moneycontrol App to stay updated!