


Rajesh Palviya
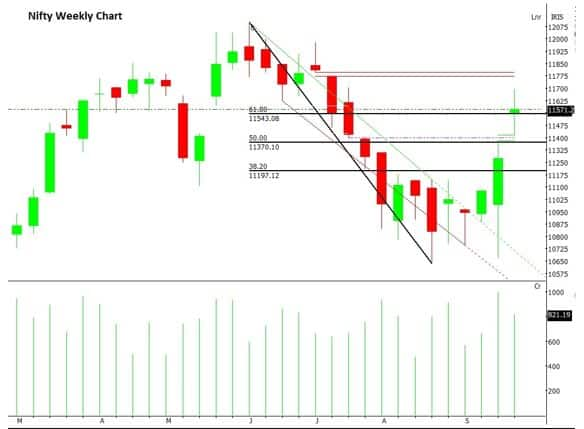
Nifty consolidated within a narrow trading range of 11,700-11,400 to close the week at 11,512, with a gain of 238 points, on a weekly basis.
On the weekly chart, the index formed a Doji candlestick, indicating indecisiveness the market.
The index managed to cross above 11,543. This was the 61.80 percent retracement of previous fall from 12,103 to 10,637 on a weekly closing basis, which indicates the index has strength.
The index is moving in a higher top and higher bottom formation on the weekly chart, indicating positive bias. The chart pattern suggests that if Nifty crosses and sustains above 11,620 level, it would witness buying which would lead the index towards 11,700-11,850 -12,000 levels.
However, if the index breaks below 11,400, it would witness profit-booking which would take the index towards 11,300-11,250.
Nifty is trading above its 20, 50, 100 and 200-day SMAs, which are important short-term moving average, indicating positive bias in the short-term.
The index continues to remain on an upward trajectory in the medium-term, so buying on dips continues to be our preferred strategy.
For the week, we expect Nifty to trade in the range of 11,800-11,300 with mixed bias. The weekly strength indicator RSI and momentum oscillator Stochastic have both turned positive and are above their respective reference lines, indicating positive bias.
Option data analysis
Weekly series highest OI on call side for Nifty stands at 11,600 CE of 20.93 lakh shares, followed by 11,700 of 15.88 lakh shares and 12,000 of 14.08 lakh shares,
An addition on the call side was observed in 11,600 CE of 10.30 lakh shares, 11,700 CE of 6.34 lakh shares.
Highest OI on put side stands at 11,500 PE of 12.55 lakh shares, followed by 11,000 PE of 12.07 lakh shares and 11,400 PE of 11.75 lakh shares, while an addition on the put side was observed at 11,400 PE of 4.55 lakh shares, 11,000 PE of 4.44 lakh shares.
Bank Nifty
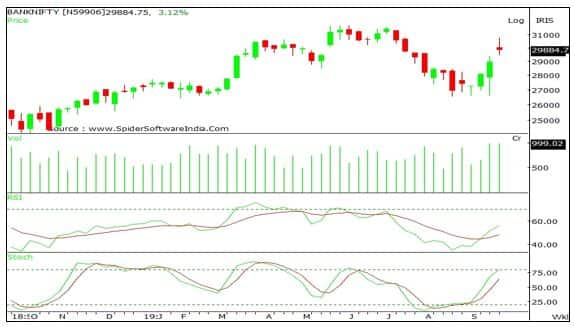
Bank Nifty consolidated throughout the week within a narrow trading range of 30,800-29,470 to close on a positive note. The index closed at 29,877 with a gain of 895 points on a weekly basis.
On the weekly chart, the index has formed a Long-legged Doji candlestick, indicating indecisiveness.
The index is moving in a higher top and higher bottom formation on the weekly chart, indicating positive bias. The chart pattern suggests that if Bank Nifty crosses and sustains above 30,400, it would witness buying which would lead the index towards 30,600-31,000.
However, if the index breaks below 29,450, it would witness selling which would take the index towards 29,050-28,580.
Bank Nifty is trading above 20, 50 and 200-day SMAs which are important short-term moving average, indicating negative bias in the short-to-medium-term.
Buying on dips continues to be our preferred strategy. For the week, we expect Bank Nifty to trade in the range of 30,850-29,000 with mixed bias.
The weekly strength indicator RSI and momentum oscillator Stochastic have both turned positive and are above their respective reference lines, indicating a positive bias.
Option data analysis
Weekly highest OI for Bank Nifty stands at 31,000 CE of 6.54 lakh and 32,000 CE of 4.59 lakh. An addition on the call side was observed at 31,000 CE of 3.93 lakh shares, 32,000 of 2.66 lakh shares.
Highest OI stands at 30,000 PE of 4.73 lakh, followed by 29,000 PE of 3.39 lakh shares. An addition on the put Side was observed at 30,000 PE of 2.14 lakh shares, 29,000 PE of 1.46 lakh shares.
Stocks in focus
Reliance Industries: Buy | LTP: Rs 1,307.50 | Target range: Rs 1,360- 1,385 | Stop loss: Rs 1,240
On the weekly chart, the stock has decisively broken out from its “downsloping trendline” on a closing basis and is sustaining above the same.
This breakout was accompanied by the increase in volumes which supports bullish sentiments ahead.
The daily, as well as, weekly strength indicator RSI, and the momentum indicator Stochastic are in positive territory which supports upside momentum to continue in the near-term. The stock is sustaining well above its 20, 50 and 100-day SMAs which is a bullish signal.
Torrent Power: Buy | LTP: Rs 290.15 | Target range: Rs 305- 310 | Stop loss: Rs 276
On the weekly chart, the stock has decisively broken out from its “downsloping trendline” on a closing basis and is sustaining above the same.
This breakout has accompanied with an increase in volumes which supports bullish sentiments ahead.
The daily, as well as, weekly strength indicator RSI, and the momentum indicator Stochastic are in positive territory which indicates upside momentum may continue in the near-term.
The stock is sustaining well above its 20, 50 and 100-day SMA which is a bullish sign.
Manappuram Finance: Buy | LTP: Rs 143.20 | Target range: Rs 140-152 | Stop loss: Rs 133
On the daily chart, the stock has formed a “rounding bottom” pattern on a closing basis and is sustaining above the breakout levels.
This breakout has accompanied with an increase in volumes which supports bullish sentiments ahead.
The daily, as well as, weekly strength indicator RSI, and the momentum indicator Stochastic are in positive territory which supports upside momentum will continue in the near-term.
The stock price is sustaining well above its 20 and 50-day SMAs which signals bullish sentiments ahead.
Finolex Industries: Buy | LTP: Rs 583.75 | Target range: Rs 605- 618 | Stop loss: Rs 553
On the weekly chart, the stock has decisively broken out from its multiple resistance zone of 555-560 on the closing basis and is sustaining above the same.
This breakout has accompanied with an increase in volumes which supports bullish sentiments ahead.
The weekly strength indicator RSI and the momentum indicator Stochastic are in positive territory which supports upside momentum to continue in the near-term.
The stock is sustaining well above its 20, 50 and 100-day SMAs which signals bullish sentiments ahead.
The author is Head - Technical and Derivatives Research at Axis Securities.
Disclaimer: The views and investment tips expressed by the investment expert on Moneycontrol.com are his own and not that of the website or its management. Moneycontrol.com advises users to check with certified experts before taking any investment decisions.
Discover the latest business news, Sensex, and Nifty updates. Obtain Personal Finance insights, tax queries, and expert opinions on Moneycontrol or download the Moneycontrol App to stay updated!


