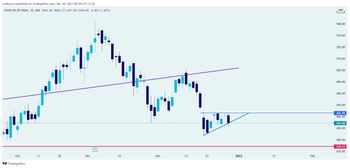
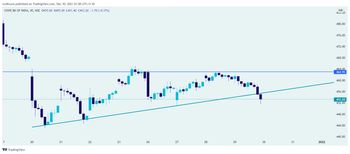
#SBIN Two charts for SBI, Ist is Daily chart- forming an ascending triangle, breakout above 462 and immediate target is around 480 and second is 45 minutes time frame with failed ascending triangle, sell side target is 434. Which one you choose for 31/12/2021Pick wisely. Good luck. Happy trading
❮
❯