Reliance Industries Limited has evolved from being a textiles and polyester company to an integrated player across energy, materials, retail, entertainment, and digital services. Reliance's products and services portfolio touches almost all Indians on a daily basis, across economic and social spectrums.
FINANCIALS 📊
• Stock is trading at a P/E of 29.7 while the industry P/E is at 4.59, Debt to equity ratio is at 0.36, and ROCE at 9.63%
• RIL’s results were below estimates on the profitability front on account of weaker-than-expected O2C (oil-to-chemicals) earnings
• Revenue was up 36.8% YoY to INR 211887 Cr as all segments reported revenue growth
• EBITDA was at INR 31366 Cr, up 34.3% YoY, 5.6% QoQ. EBITDA growth YoY was driven by O2C (up 24.8% YoY) and digital service (up 25.3% YoY) mainly on account of higher refining earnings in O2C coupled with a tariff hike undertaken in December 2021
• PAT was at INR 16203 Cr, up 22.5% YoY. PAT declined 12.6% QoQ owing to lower other income and an exceptional gain of INR 2836 Cr reported in Q3FY22
HIGHLIGHTS 📣
• Steady FCF generation in the retail segment would enable the company to maintain debt at lower levels and improve its ability to invest in future inorganic opportunities
• Increment value accretion from the ‘digital ecosystem’ that will be captured at the JPL (Jio Platforms) level
• Strong cash flow in the O2C segment is expected in the near term owing to higher product cracks and will enable RIL to invest in new energy verticals
• Given the SIM consolidation and impact of the tariff hike of undertaken in December 2021 (20-25% hike in the prepaid segment), JPL’s ARPU saw growth of 10.6% QoQ at INR 167.6
• The overall subscriber base was at 421 Mn, down 10.9 Mn QoQ. On the fibre front, the overall sub-base was at 5.3 Mn, up 0.7 Mn QoQ. While the gross addition remained strong, sim consolidation led to a net wireless customer decline of 11.5 Mn
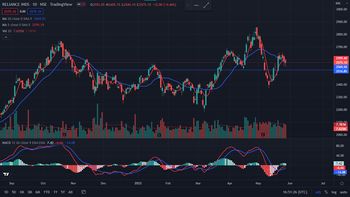
TECHNICAL ANALYSIS 📈
• Stock was moving in sideways for the last 8 months and now it has fell heavily after the Q4FY22 results
• In the MACD indicator, the 12-day MACD curve (Red curve) cuts the 26-day MACD curve (Blue curve) and moves above the 26-day MACD curve. It gives the first indication to go long on the stock
• The stock has recently touched its support and the 5-day moving average curve (Red curve) cuts the 20-day moving average curve (Blue curve) and moves above the 20-day moving average curve. it gives the confirmation to go long on the stock. Check whether the volumes are higher than the 20-day average while entering the trade
I would like to hear your views. Please share it in the comments section
Note: This is not a BUY/SELL recommendation. This is just an analysis for educational purpose
#InvestmentIdeas #TradingUniversity #InvestingUniversity