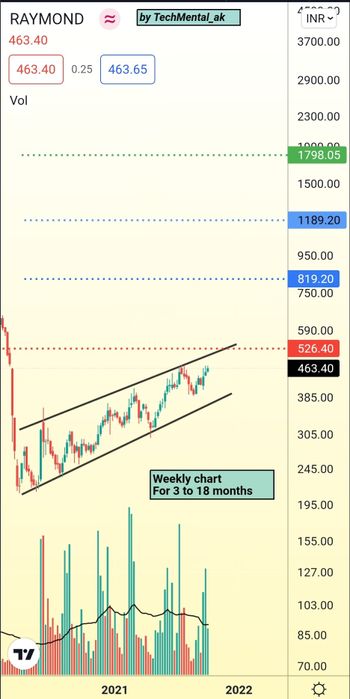
Looking good on weekly timeframe
- higher high chart structure post reversal after a down trend
- currently trading near 460/470 zone
- good demand candles observed, with >adequate volume on buy side
- not much hurdles in a way upside
A breach above 526/530 zone can lead it to 820, 1190 & 1700+ levels
Timespan : 3 to 24 months (based on weekly chart analysis)
Day close below 380 will invalidate this view
Keep an eye.
Do your analysis.