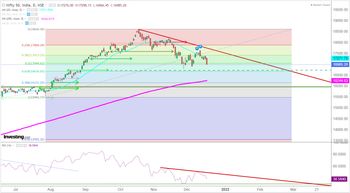
Daily chart
Near term resistance : 17500
Near term support : 16000
View : volatile
Trend : Down trend
How to : Navigate using RSI (14)
analysis done using candlesticks with resistance line (RED)marked on chart as well as RSI curve
additional Fibonacci retracement placed with MAY's LOW as support
expectations : 1. fill gap near 16670
2. go sideways for few days
3. go further down near 200DMA
4. find support near 200DMA, possibly 16000