
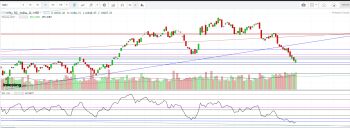
Nifty cash / Spot Analysis:
Date: 08.05.19-09.05.19
Nifty give close of 10997 forming High wave candle which a sign of neutral. It means nifty can be in a sideways.
Range:
Support. 10900-10850
Resistance -11150-11200
To move upside nifty has to hold the support of 11000-10900 on daily basis. If it holds then we can see nifty @ 11550-11600 level which will be a maximum up move for the week.
In order to continue downtrend nifty should fails to hold the 11250-11300 levels.
Also, Dollar looking strong in comparison to Nifty-50.
Monthly and Weekly view:
Nifty looking weak on bigger time frame as their RSI is also moving towards bearish zone. IF momentum continues then we can see more downfall till 10550-10500 levels.
MACD also started moving in bearish zone.
Note: Above analysis is just for study purpose. Please take help of financial adviser before going for trade.