
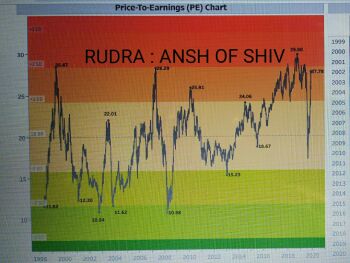
Nifty PE chart
2000 to till date,,
Current PE of nifty is at 27.78
Trading around 2SD levels
Historically when ever Nifty PE reaches around 2SD levels sharp fall in markets are observed.
Accurate 2SD level is around 28.35.
so 28.35- 27.78 =0.57 points away from 2SD levels.
EPS of Nifty is at 382 levels..
Nifty to reach accurate 2SD levels on PE front can still move higher by (0.57 * 382 = 218 points) from recent high.
Nifty have registered high of 10847 recently,, above that we can still move higher by 218 points, which would lead nifty to around 11065 levels.
If Nifty PE follow history and falls from 2SD levels, we can see levels of 1SD which is around 24.06, also yearly average PE of nifty for this year is around 24.02.
On that basis if consider this scenario from current rate of Nifty PE and current rate of Nifty, we get 27.78 - 24.06 = 3.72 points fall on PE front,, which would lead Nifty to ( 3.72*382 =1421) (cmp nifty 10768 - 1421 points as per PE fall = 9347) 9347 levels.
If Nifty pe falls to center point (neutral point), which is around 19.98. or to low of this year which is around 20.38. Which is also possible.
On that basis, if we consider this scenario from current rate of Nifty PE and current rate of Nifty, we get 27.78 - 20.38 = 7.4 points fall on PE front, which would lead Nifty to (7.4 * 382 = 2827) (CMP Nifty 10768 - 2827 points as per PE fall = 7941 ) 7941 levels.