
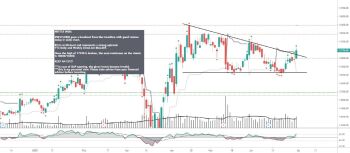
NESTLE INDIA
#NESTLEIND gave a breakout from the trendline with good volume today in daily chart .
RSI is at 60-level and represents a strong uptrend.
TT2 Daily and Weekly trend are BULLISH .
Once the high of 17298 is broken, the next resistance on the charts is 18000/18400.
KEEP AN EYE!!
***in case of GAP opening, the given levels become invalid.
***this is my personal view. Please take advice from your financial advisor before investing.