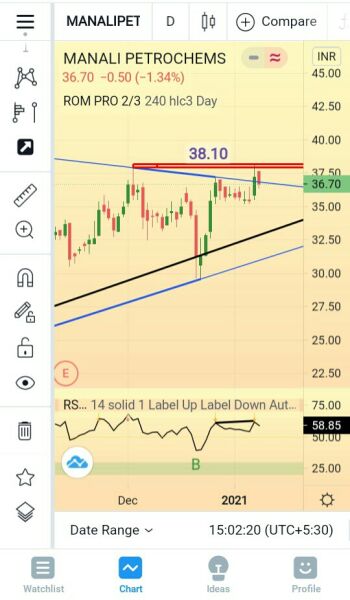
#MANALIPETC Daily chart Showing RSI bearish divergnce is well as on weekly chart. Resistance around 37.5-38.20. Above this it can Go to 44/48/52+ ,SL 34. Please do ur own analysis before taking any trade.