
KOTAKBANK
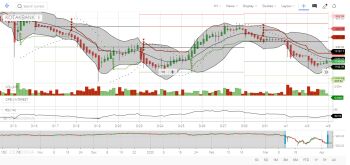
Two spinning tops formed were formed on Friday and the stock moved upward from that on hourly charts of KOTAKBK. Further, KOTAK’s up move may see some restriction as per 5min as well as hourly HA Chart at or around 1225.55 levels. The charts are looking bullish so far so, but the uncertainty may give wild swings on either side.
Anyone considering buying KOTAKBANK may consider the same if sustaining above 1175.50 on 5min as well as hourly charts for target of 1190.45 followed by 1207 and 1225.25. However, it would be prudent to book and keep trailing your positions around given levels.
On the short side a trade is advised only if on 5min as well as hourly charts it is sustaining below 1141.95 with target of 1125.55 followed by 1113.75 and 1089.45.
My personal bias is indecisiveness with further bearishness in KOTAKBANK but will consider waiting for clear direction rather entering the trade, however it is wise to stick to levels give only.
p.s. –. Trading in current markets is very risky due to uncertainty and volatility in the market but will trade as per my given levels only. Please trade as per your comfort and risk. These levels have derived by analyzing Options data and spot price movement.