
ITC
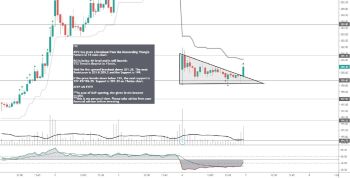
#ITC has given a breakout from the Descending Triangle Pattern in 15 mins chart.
RSI is below 40-level and is still Bearish .
TT2 Trend is Bearish in 15mins.
Wait for the upward breakout above 201.35. The next Resistance is 203.8.205.2 and the Support is 199.
If the price breaks-down below 199, the next support is 197.95/196.25. Support is 201.35 on 15mins chart.
KEEP AN EYE!!
***in case of GAP opening, the given levels become invalid.
***this is my personal view. Please take advice from your financial advisor before investing.