
ICICI Bank
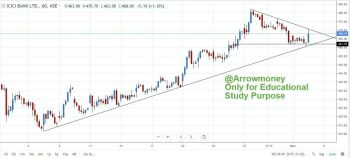
- On Hourly chart Consolidation in Triangle Pattern
- Breakout above 475 may again lead to new Lifetime High
- Holding Support near 460, Break down this may lead to 450-437 Levels to come
- Daily chart shows some over-sold signals so High probability to give breakout above this consolidation
- OI Data: 450 Support, 480 Resistance to cross
Disclaimer: All the View/Study Given from Arrowmoney are only for Educational study purpose. Consult your financial adviser before making any investment decision.