💡 Hindalco 💡
Hindalco Industries Ltd. is a subsidiary of the Aditya Birla Group. The company and its subsidiaries are primarily engaged in the production of Aluminium and Copper. It is also engaged in the manufacturing of aluminum sheet, extrusion, and light gauge products for use in packaging markets like beverage and food, can and foil products, etc.
FINANCIALS 📊
• Stock is trading at a P/E of 5.57 while the industry P/E is at 11, the Debt-to-equity ratio is at 0.86, and ROCE at 16%
• Revenue grew by 37.7% YoY to INR 55,764 Cr in Q4FY22, driven by higher aluminum and copper prices
• EBITDA margin shrank 90bps YoY to 13.1%, owing to cost inflation
• PAT grew by 116.6% YoY in Q4FY22 to INR 4,102 Cr
HIGHLIGHTS 📣
• Novelis EBITDA decreased by 15% YoY to INR 3,247 Cr in Q4 FY22, primarily due to short-term operational cost challenges
• Copper business EBITDA grew by 20% YoY to INR 387 Cr in Q4FY22, on the back of better operational efficiencies and improved by-product realizations
• The Company witnessed total cost inflation in Q4FY22 at 9.5% QoQ and the company expect 15% cost inflation on a QoQ basis in Q1FY23, mainly due to higher coal costs
• Hindalco is working on a large-scale renewable hybrid project (Pumped Hydro), which can provide up to 100 MW to 300 MW for the Aditya plant with connectivity to the 400 KV National Grid targeted by December 2023
• CAPEX for FY23 is guided to be USD 1.3 Bn to USD 1.6 Bn for Novelis and INR 3,000 Cr for India
• Novelis recently announced a USD 2.5 Bn greenfield fully integrated rolling and recycling plant in the U.S. that will support the strong demand for aluminum beverage packaging and automotive solutions in this region
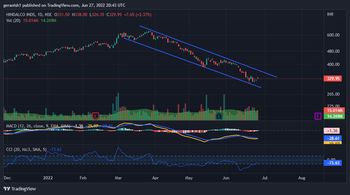
TECHNICAL ANALYSIS 📈
• Stock has been moving in a downtrend for the past four months
• CCI indicator shows the stock is at an oversold region. It gives the first indication to go long on the stock
• In the MACD indicator, the 12-day MACD curve (Yellow curve) is about to cut the 26-day MACD curve (Blue curve) and moves above the 26-day MACD curve, it gives the conformation to go long on the stock. Check whether the volumes are higher than the 20-day average before entering the trading
I would like to hear your views. Please share it in the comments section
Note: This is not a BUY/SELL recommendation. This is just an analysis for educational purpose