
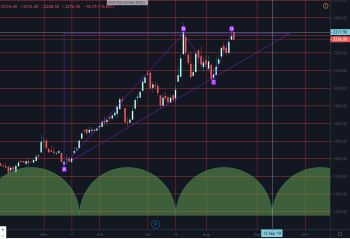
Detailed analysis of HDFCAMC,
Price action formed Ascending Triangle Pattern,
accompanying volume data also support this claim, (volume is heavy on the upside, and low on dips as compared)
current price action is undergoying and forming another dip, which may come to
2200 levels (psychological levels),
But Upon placing time cycle and applying the principles of ascending triangle (that is, prices are most likely to break resistance 2/3 (66%) horizontal distance of triangle)
Prices
are likely to break the triangle (resistance) before 12 sept.