
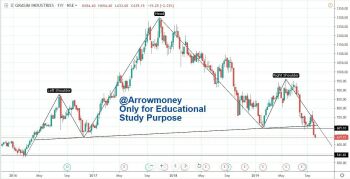
Grasim
- Big Break down on Big Charts
- Bearish Head & Shoulder Pattern Break down on Weekly Charts
- RSI Going below 30
- Sustain below 600 can test 580-545 Levels in coming days
- 542 seems Good Support on Weekly Chart
OI Data: 700 Strong Resistance
Disclaimer: All the View/Study Given from Arrowmoney are only for Educational study purpose. Consult your financial adviser before making any investment decision.