
GAIL INDIA LTD.
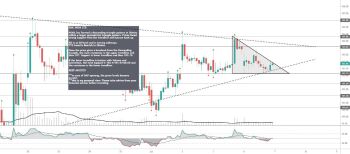
#GAIL has formed a descending triangle pattern in 30mins within a larger symmetrical triangle pattern . Prices faced strong Support from the trendline and bounce back up.
RSI is at 50-level and is moving sideways.
TT2 trend is Bearish in 30mins.
Once the price gives a breakout from the Descending triangle , the next resistance is the upper trendline and then 107. Support is lower trendline and then 103.15.
If the lower trendline is broken with Volume and Conviction, the next Support is 102.4/101.5/100.65 and the resistance is the lower trendline .
KEEP AN EYE!!
***in case of GAP opening, the given levels become invalid.
***this is my personal view. Please take advice from your financial advisor before investing.