Motherson Sumi Systems is engaged primarily in the manufacture and sale of components to automotive original equipment manufacturers. Motherson Sumi Systems is India’s largest Ancillary company and it is amongst the world's largest manufacturers of exterior rear-view mirrors with a dominant market share and is a leading global player in polymer-based interior and exterior modules.
FINANCIALS 📊
• Stock is trading at a P/E of 62.5 while the industry P/E is at 23.8, Debt to equity ratio is at 0.69, and ROCE at 8.04%
• 4QFY22 performance was a mixed bag as India business performed strongly, whereas the SMRPBV business witnessed substantial headwinds of cost inflation
• FY22 revenue rose 10% YoY to INR 63,536 Cr and grew 4% QoQ
• EBIDTA margins has been declining for the past 6 years from 10% to 7%
• Due to restructuring of business PAT fell by 10% YoY to INR 874 in FY22
HIGHLIGHTS 📣
• Chip shortage is improving on a daily basis and management expects it to improve considerably from September 2022
• 4QFY22 was the first quarter of transition into a new structure of the Motherson group. Hence, there were several adjustments as well as a lack of comparable numbers for the consolidated entity on a YoY basis
• Backed by revival of worldwide OEM client volumes, strong order book, and EV neutral product profile, 11% net sales CAGR is expected over FY22-23E
• Increasing share of revenues from EVs greater than 3.5% vs. 3% in H1FY22
• Margins have seen rising to 10.1% by FY23E on the back of higher capacity utilization at greenfield plants and operating leverage benefits. Consequent RoCE is expected at more than 10% by FY23E
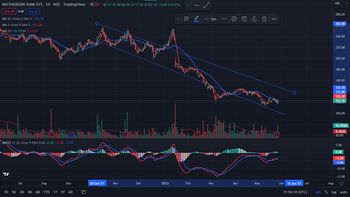
TECHNICAL ANALYSIS 📈
• Stock was moving in a downward trend for the last 8 months
• In the MACD indicator, the 12-day MACD curve (Red curve) cuts the 26-day MACD curve (Blue curve) and moves above the 26-day MACD curve. It gives the first indication to go long on the stock
• The stock has recently touched its bottom trendline and the 5-day moving average curve (Red curve) is about to cut the 20-day moving average curve (Blue curve) and move above the 20-day moving average curve. it gives the confirmation to go long on the stock. Whenever the 5-day MA curve moves above the 20-day MA curve, one can enter the trade. Also, the volumes are higher than the 20-day average
I would like to hear your views. Please share it in the comments section
Note: This is not a BUY/SELL recommendation. This is just an analysis for educational purpose
#InvestmentIdeas #InvestingUniversity #TradingUniversity