Thermax Trend Analysis
Pattern looks like reverse Head & Shoulder with break above its neckline and now price is retesting the neckline.
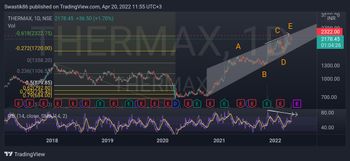
In my opinion price was moving in a rising wedge pattern as highlighted in my chart.
Strong divergence in RSI is commonly seen in this pattern.
Though volume is above average but its trend is declining.
The pattern has completed and the top was exactly at 0.618 fib extension.
I am NOT BULLISH on this chart.
It's upto you to trade or not.
Peace ✌️