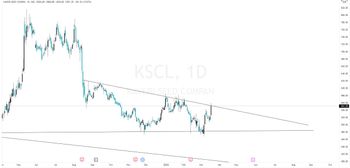
#KSCL daily timeframe
.
.
* If you see this stock in weekly timeframe you can clearly see triangle pattern
* Now the price is in the support zone and also in a pattern
* When it breaks the trendline we can expect it to touch the upper resistance trendline
* Watch closely