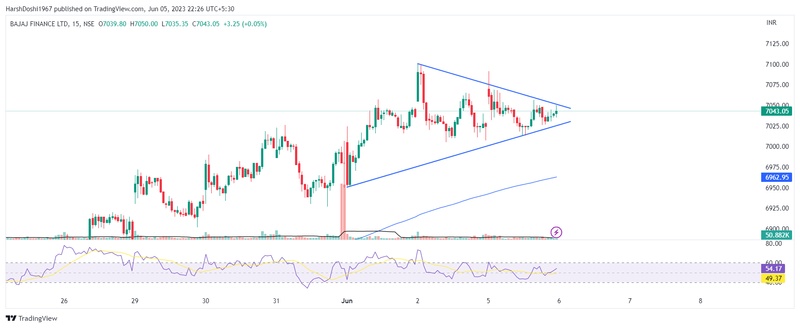
Bajaj Finance is currently exhibiting a symmetrical triangle pattern on the 15-minute timeframe. As an intraday trader, this formation presents an opportunity to take advantage of a potential breakout in either direction. Traders can monitor the price closely and look for a decisive move above the upper trend line as a signal to go long or below the lower trend line as a signal to go short.