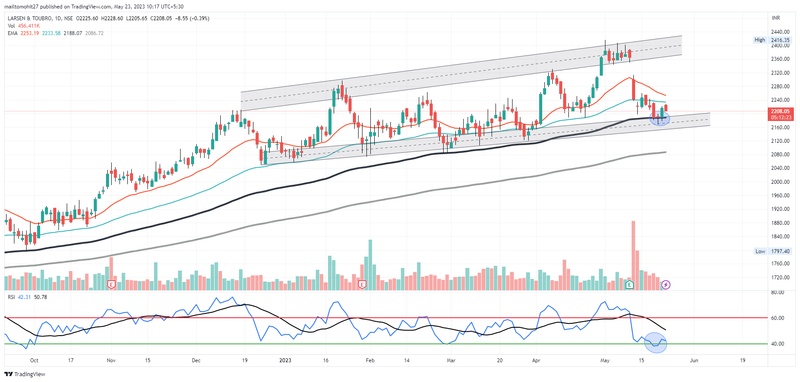
LT looks like running in an up trending channel. And now looking for positive move from the lower side of the channel towards upper side.
Confluences are as follow:
• On daily time frame, Price is at the low of the up trending channel.
• Price is taking support at 100EMA on daily time frame.
• RSI is taking support around 40 on daily time frame, which is an important level of RSI.
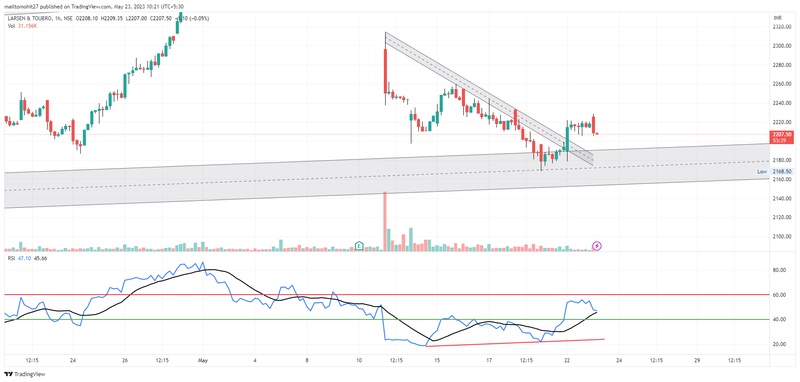
• On 1 Hour time frame, Looks like price is clearing the downtrend.
• RSI divergence can be observe on 1 hour time frame.
Now we need to think about the risk management. And plan our trade accordingly.
Plan Entry, Stop Loss & quantity first. Then plan the target.
Keep Learning
Follow the Process
Keep you Capital Safe.
Note:- Please note that this has been posted just for the learning purpose and not a stock recommendation. Make your trades at your own risk.
❮
❯