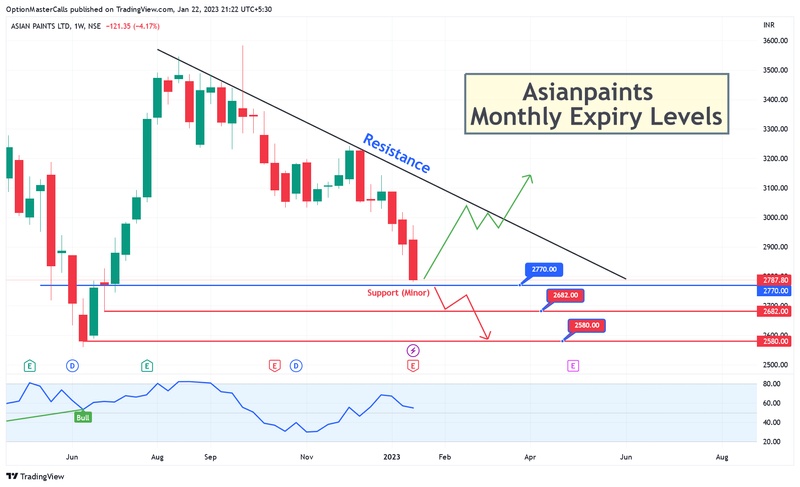
💎Asianpaint Monthly Expiry Chart:
🔰Asianpaint made swing high of 3584 on last Sep and after that it is keep coming down despite of crude oil is came to below $90.
🔰Technically it has falling trendline resistance on Day/Weekly chart and due to that its becoming weaker on every hit.
🔰2770 on day chart will be a small support and after that 2682 and 2580 is a sure possibility. So sell Asianpaints below 2770.
🔰Buy if only it clears the trendline with a huge volume. Then we can see 3100++ levels.