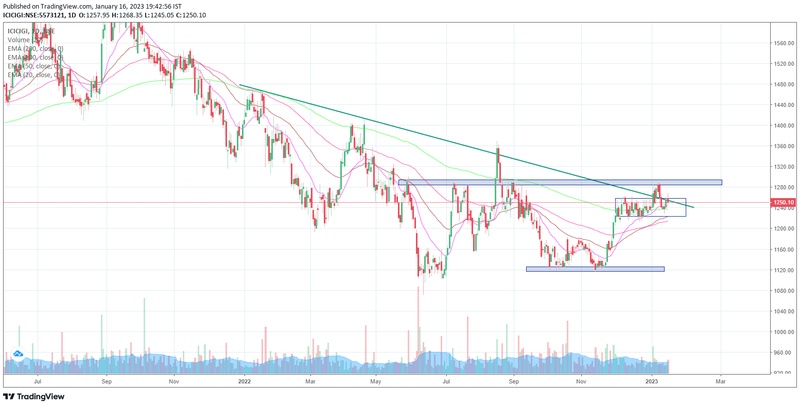
ICICIGI - Daily chart - looks good as positional buy trade on closing above 1290-95 level, double bottom on daily timeframe, trading above all 4 ema's (20, 50, 100, 200), trend line breakout for second time, breaking out from consolidation zone of more than 1 month. (For education purpose only)