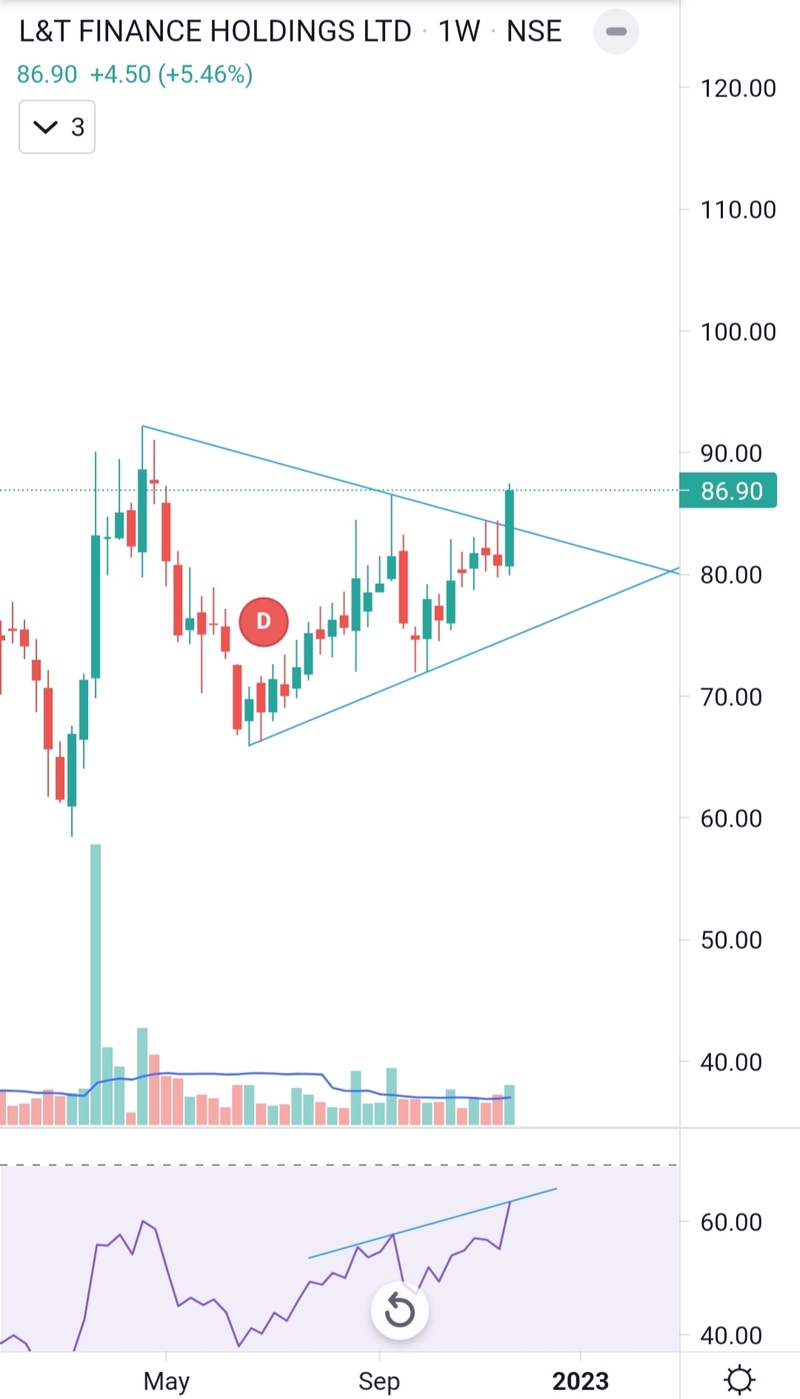
Chart pattern: Symmetric triangle pattern. Stock has given a breakout and closed above the resistance like or upper trend line of symmetrical triangle pattern.
Candle stick pattern: Bullish engulfing pattern is formed on weekly chart at the resistance line and the breakout candle is similar to Marubozu candle which is extremely bullish candle and it indicates buyers are in great control.
Volume: Volume spike is seen on breakout candle and volumes trades are above than the average volume traded line.
RSI: RSI indicator is showing positive divergence with increase in price.
PCR: Price to call ratio of this stock is 0.49 on 26/11/2022. This value indicates bearishness and below 0.50 of PCR value is oversold zone where call writers will book their profit which interms moves the prices higher.
Data: In future long buildup is seen with 5.49% change in price and 14.66% change in open interest.
Option chain analysis: In both ITM and OTM call buying taking place which is bullish in nature and in put side put selling is seen which is also bullish in nature.
From all this parameters it is evident that price may continue bullish trend in near future.