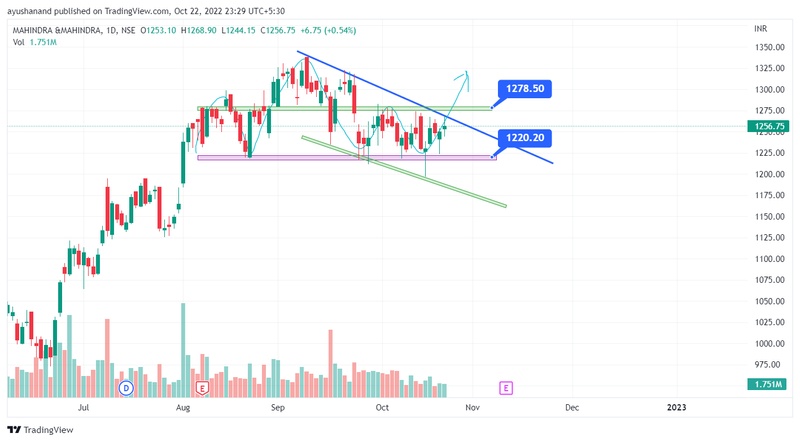
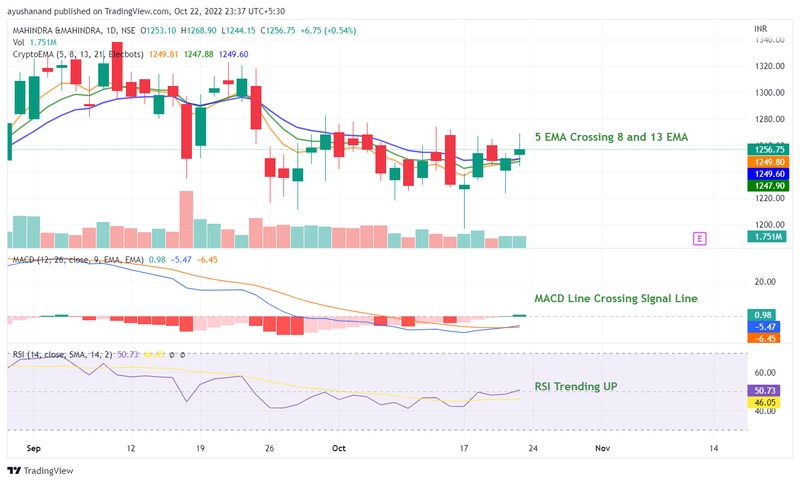
M&M Chart Looks Bullish - Both Price Action and Technical Indicators
Mahindra & Mahindra Limited
- Head & Shoulder patterns failed
- Falling wedge pattern
Support & resistance levels in Charts
- 5 EMA Crossing 8 and 13 EMA
- MACD Line Crossing Signal Line
- RSI Trending UP
❮
❯