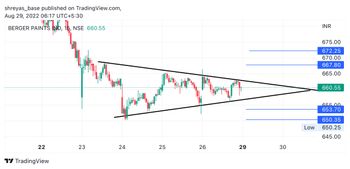
Intraday for today#BERGEPAINTSymmetric triangle pattern Trendline giving support from below Another trendline giving rejections from above Go long after breakout of upper trendline Go short after breakdown of lower trendline Take blue lines as tgts