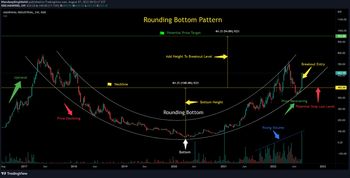
The Rounding Bottom is a long-term reversal pattern that is best suited for weekly charts. It is also referred to as a saucer bottom, and represents a long consolidation period that turns from a bearish bias to a bullish bias.
1. Decline: The first portion of the rounding bottom is the decline that leads to the low of the pattern.
2. Low: The low of the rounding bottom can resemble a “V” or "U" bottom, but should not be too sharp and should take a few weeks to form.
3. Advance: The advance off of the lows forms the right half of the pattern and should take about the same amount of time as the prior decline.
4. Breakout: Bullish confirmation comes when the pattern breaks above the reaction high that marked the beginning of the decline at the start of the pattern. To trade this pattern look for the neckline that is marked on the chart. Once the price breaks through and a candle closes above the neckline, you can then enter the market with a buy order.
5. Volume: Volume levels are not too important on the decline, but there should be an increase in volume on the advance and preferably on the breakout.
6. Target: Add the height of the rounded bottom to the breakout point for an estimated upside target.
7. Stop Loss: The stop loss is placed below the neckline of the pattern. When the price trades below this point, there is less chance of this pattern’s functionality. It’s better to exit the market.
The rounded bottom are reversal patterns which identify the completion of the trend and indicate a possible reversal point on price chart. The rounded bottom signals that the existing downtrend is about to finish and the possibility of an uptrend to commence. It resembles a clear “U” image.