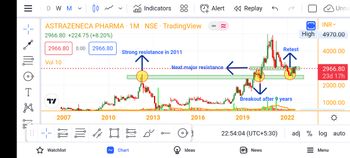
Monthly chart- Price is bounces from an area after retest, which was a resistance in 2011. It gave a breakout after 9 years. Now retesting (Attachment 1)
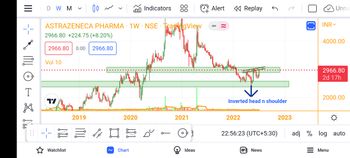
Weekly Chart - Forming inverted head and shoulder pattern. Waiting for breakout. (Attachment 2)
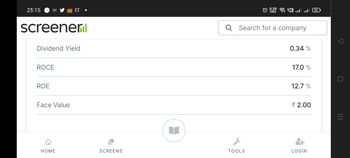
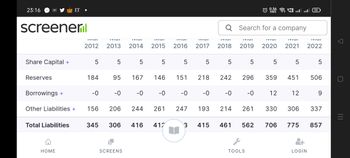
Fundamentals - Average to Good (attachment 3-4)
❮
❯