AXIS BANK LTD.
Technical analysis:
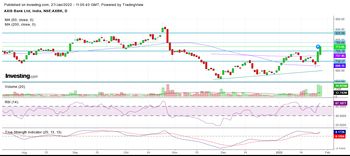
1. Stock making higher highs, higher lows means stock respect Dow Theory.
2. Stock breaks previous high of 755 with high volume.
3. RSI traded above 60 level.
4. True strength indicator traded above '0' levels.
5. Stock is traded above all 8,20,50,200 DMA.
For swing traders Buy axis bank,
Target: 825
Stop loss: 735 on a closing basis
Disclaimer: I am not SEBI registered. This is my personal view only for educational purpose. I might have this stock in my portfolio. Please do research your own or consult with your financial advisor before investing and trading.