Technical Analysis
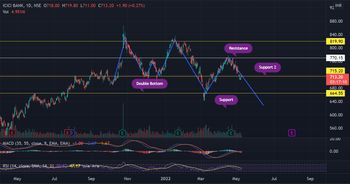
From the above graph, we can see a double bottom, A double bottom chart pattern indicates a
period of selling, causing an asset price to drop below a level of support. A double bottom is a bullish
reversal pattern because it signifies the end of a downtrend and a shift towards an uptrend.
From the graph we can see major support is at 664.55 and support 2 is at 713.20 whereas we can
see 770.15 and 819.9 these two points indicates strong resistance.
Conclusion
CMP is revolving around support 2, it can reverse from stop 2, but if it gives a breakout then it will go
till support 1 which is at 664.55.
Fundamental Analysis
• Market Cap INR 1,54,512 Cr.
• ICICI Bank is India’s second-largest private sector bank which has more than 5000 branches.
• Net interest income in Q4FY22 grew 20.8% YoY.
• PAT (Profit After Tax) grew 59% YoY to INR 7,109 Cr.
• Bank has recently tied up with Emirates Skywards, to launch a rewards-based credit card
Note: This is not a BUY/SELL recommendation, it is just an analysis by Team Vinidhan