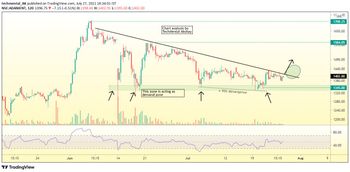
Chart of Adani Enterprises
There is a strong probability of a bullish move post trendline break in the stock.
1. 4th time try to break above the trendline
2. Positive RSI divergence is in support of a bullish move
3. 1345 acting as a strong demand zone, from where stock has bounced multiple times
4. 1400 to 1430 can be a good accumulation zone
5. Weak below 1345
6. Can look for 1580 & 1700+ levels in days
Can also act sideways and probability of getting stuck!
This is a probabilistic trade plan. Do yourr analysis before taking up any position.
Observations based on 2-Hourly chart.